Appearance
Monitoring Replication
You can monitor replication by running system view queries or using the Monitor screens in the SMC. You can also monitor replication operations from a WLM perspective.
SMC Monitoring
On the source system, go to Monitor > Replication Processes in the SMC.
Note: The SMC on the target system does not display any information about replication processes.
For example:
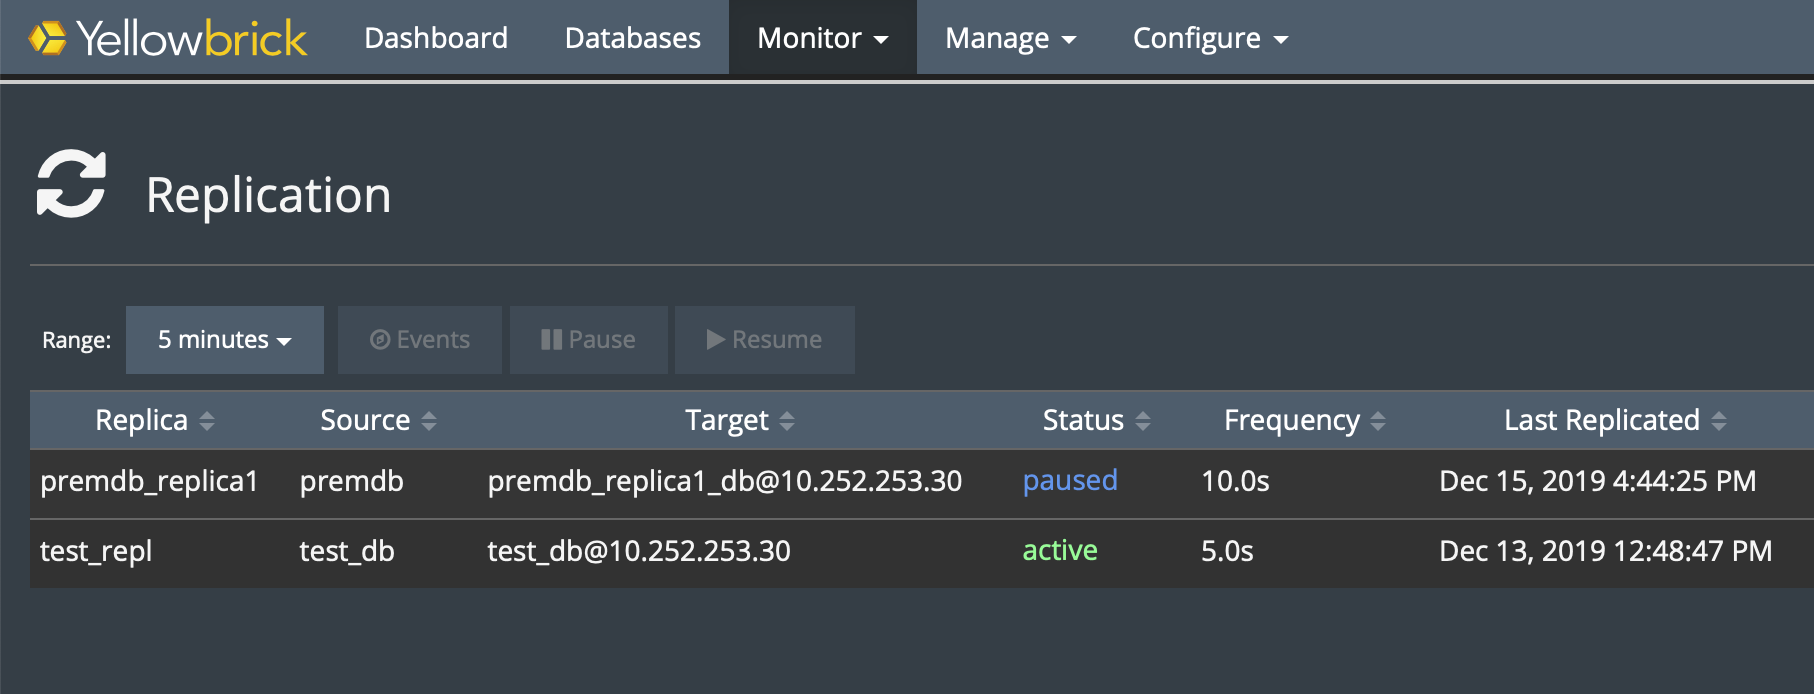
You can filter replication events, as well as pause and resume replication. Too see a full history of replication on a specific replica, select a replica from the list. For example:
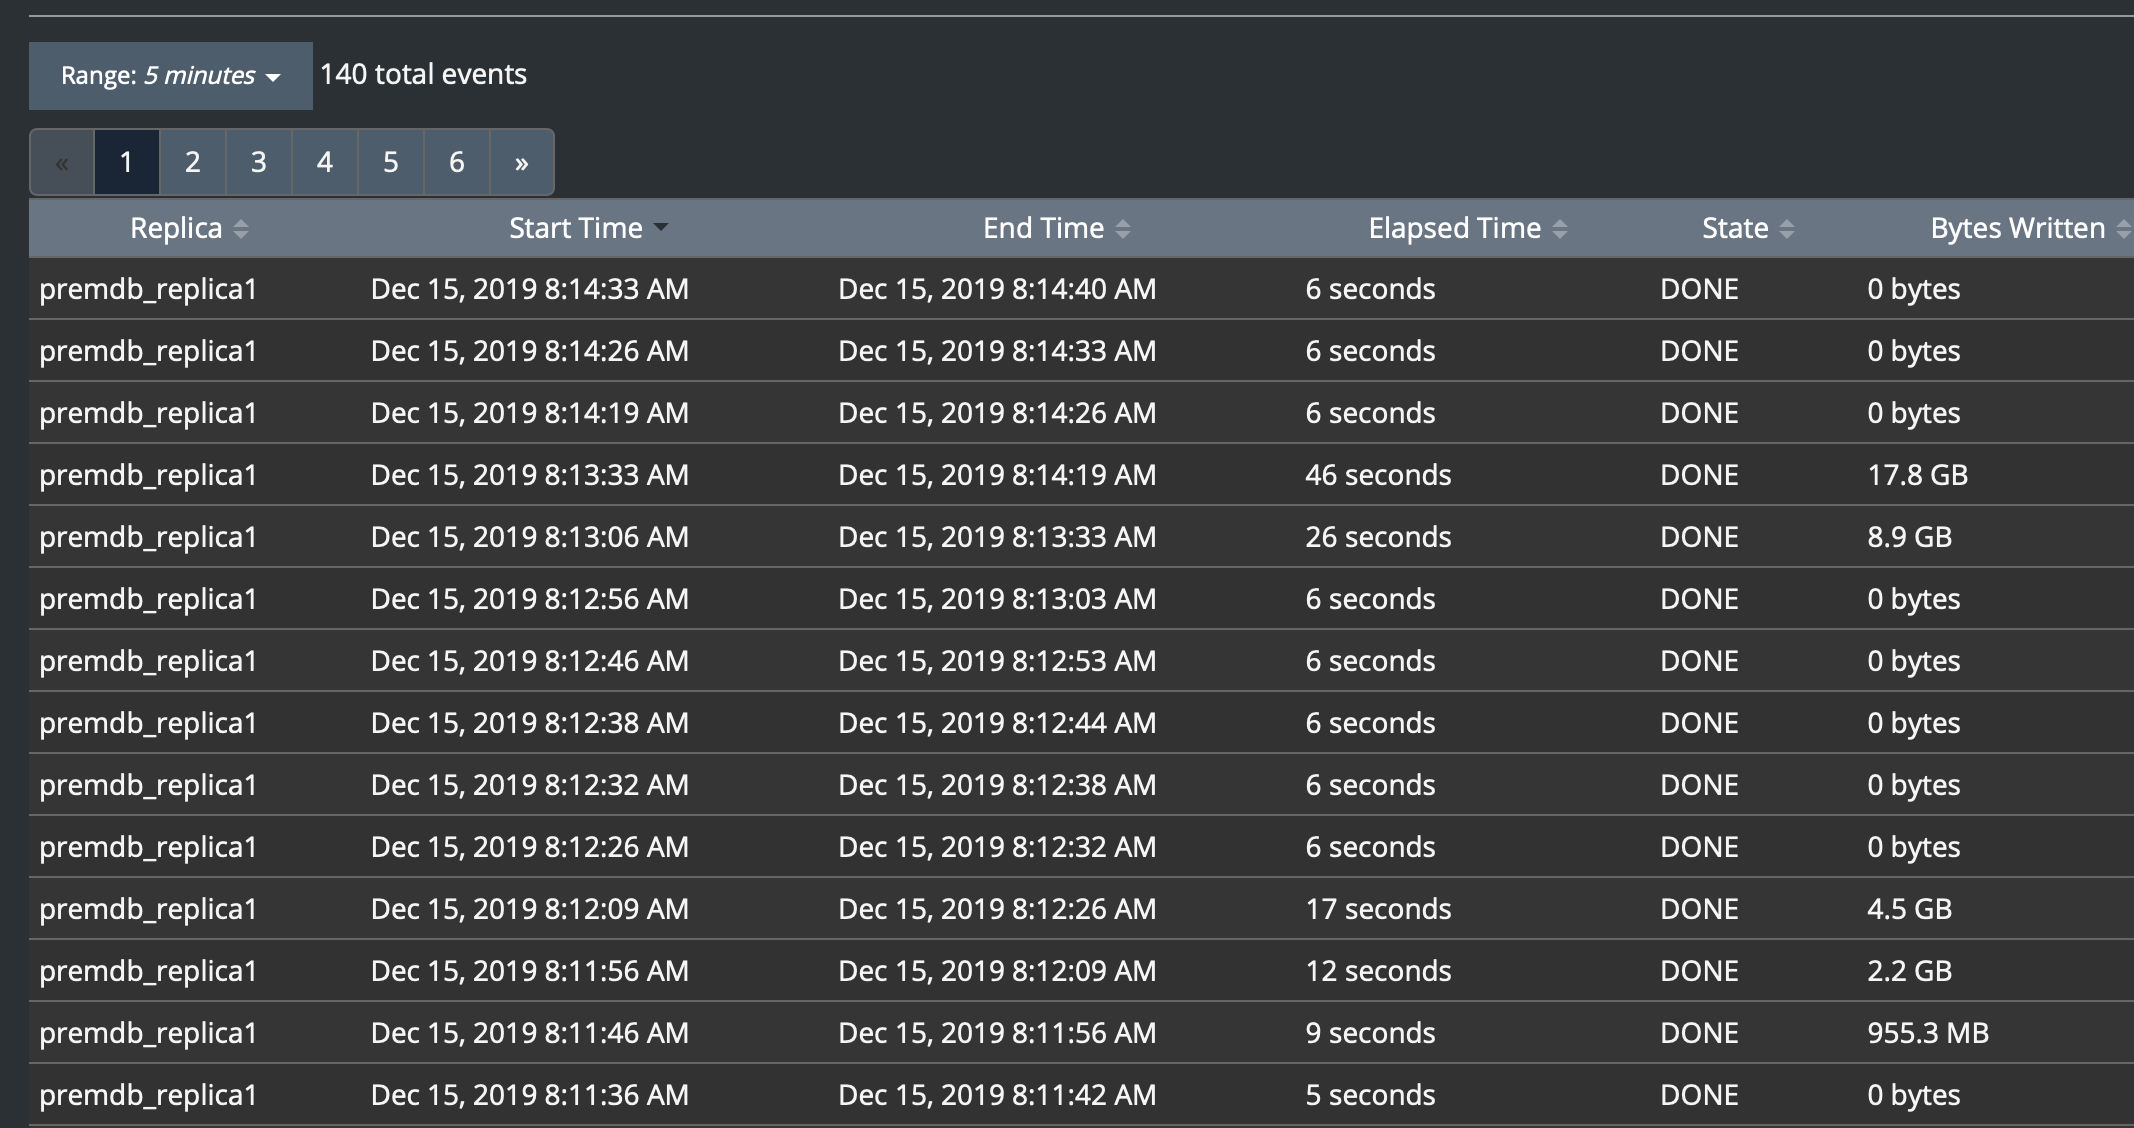
Note that the elapsed time of a replication cycle fluctuates based on the amount of data that needs to be written to the replica database.
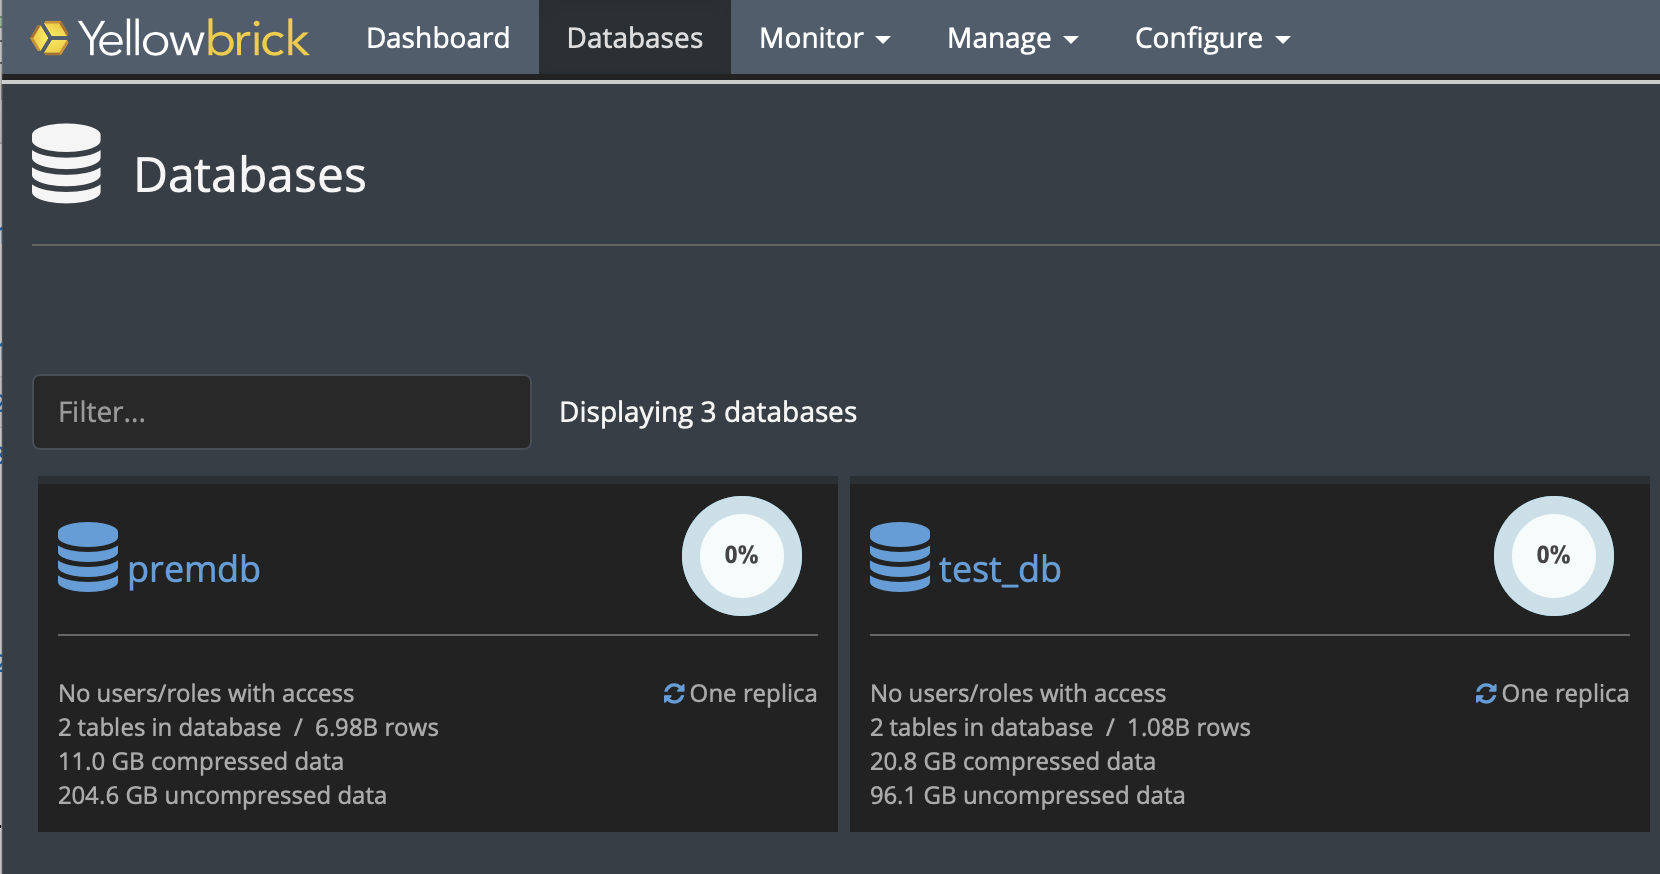
The Databases view in the SMC also shows which databases have replicas. For example:
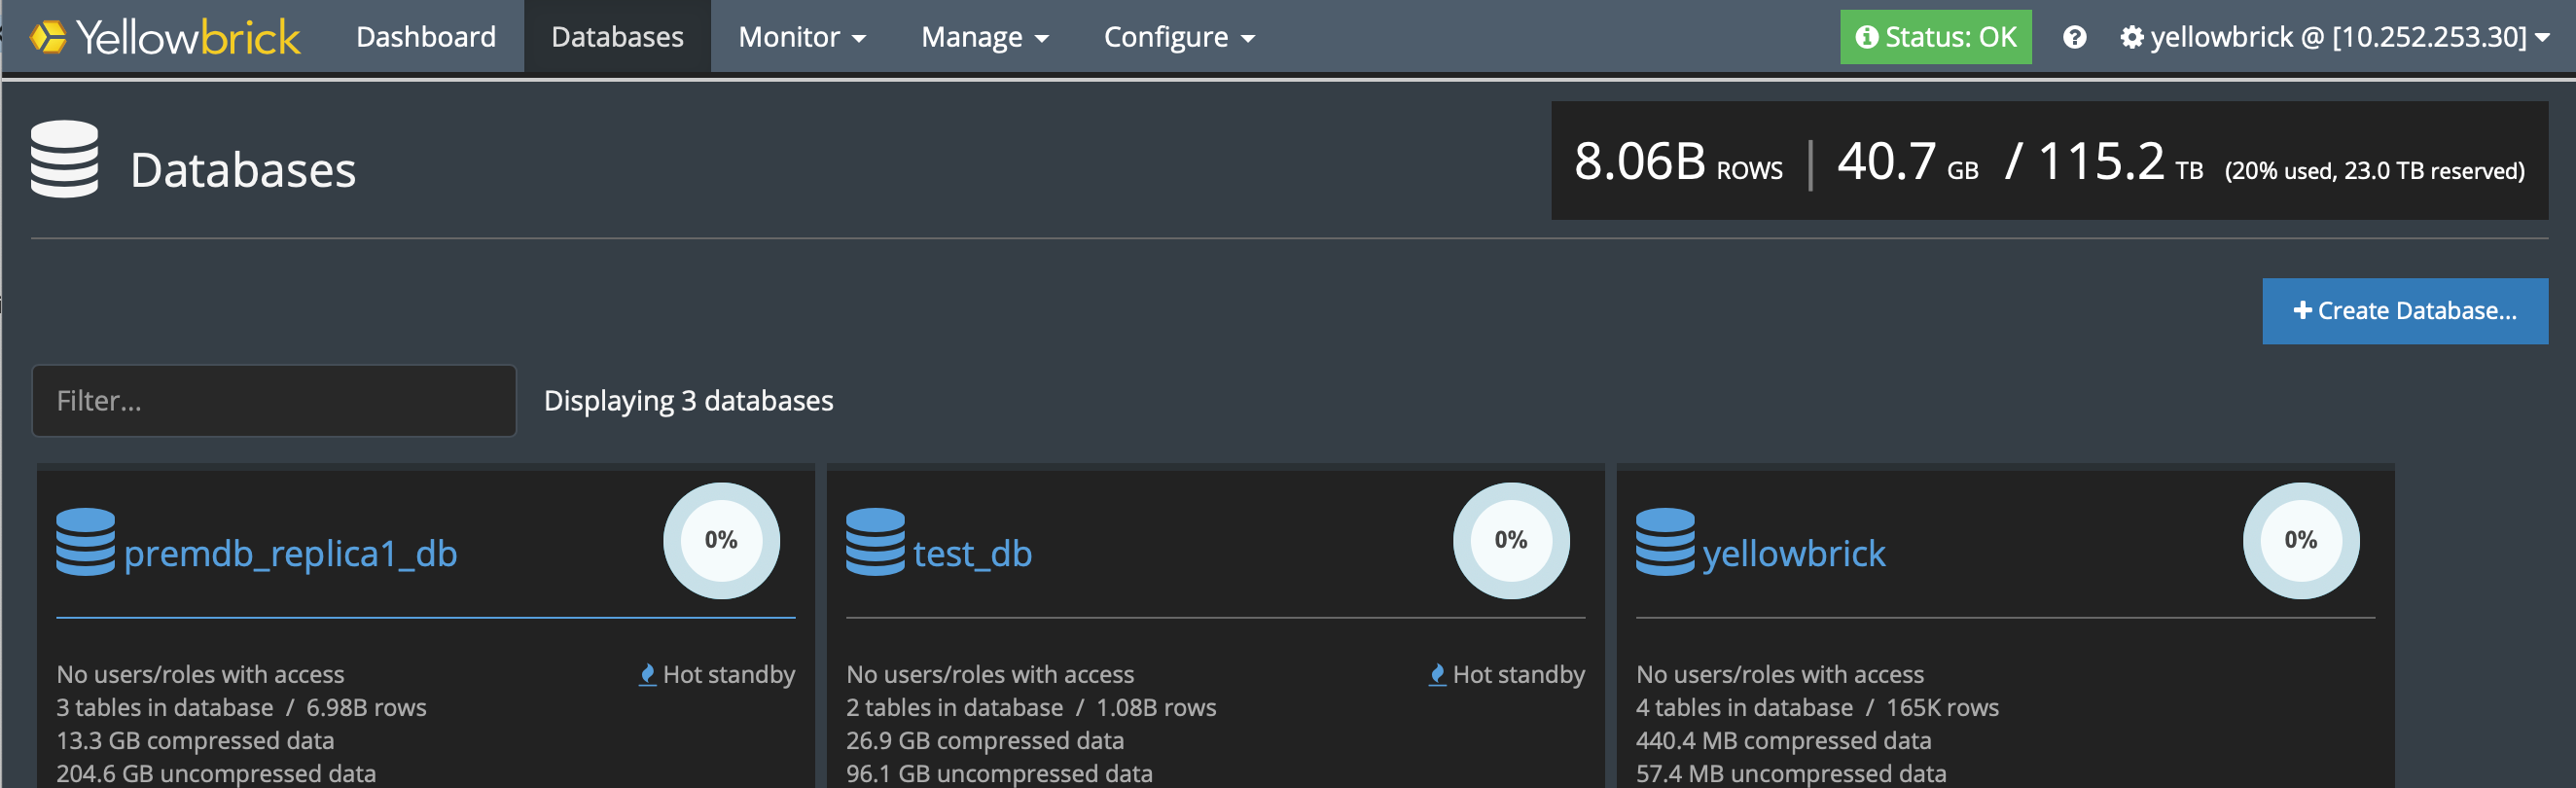
On the target system, this view shows that active replica databases are in hot-standby mode. For example:
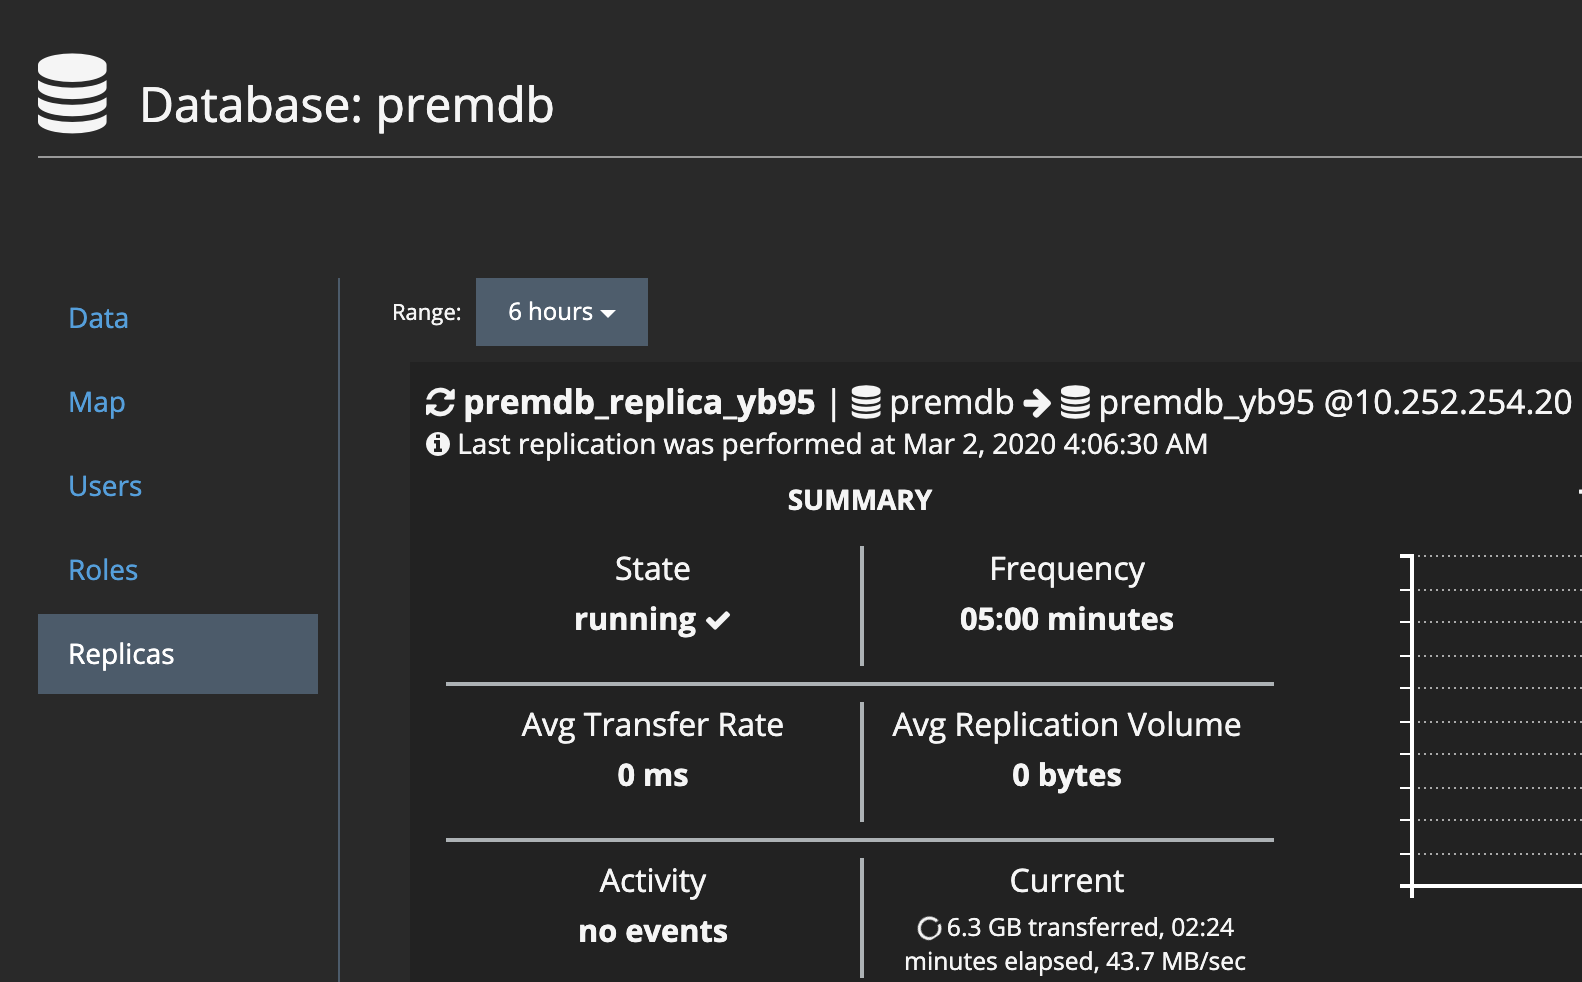
If replication is in progress, you can see the current state of a replication cycle. Select a database that has a replica, then go to the Replicas tab. Note the statistics for the current cycle in the lower-right corner. For example:
To monitor replication at the table level while replication is in progress (or just completed), go to Monitor > Active Queries, then look for YRESTORE WITH KEY queries for the replication service application. For example:
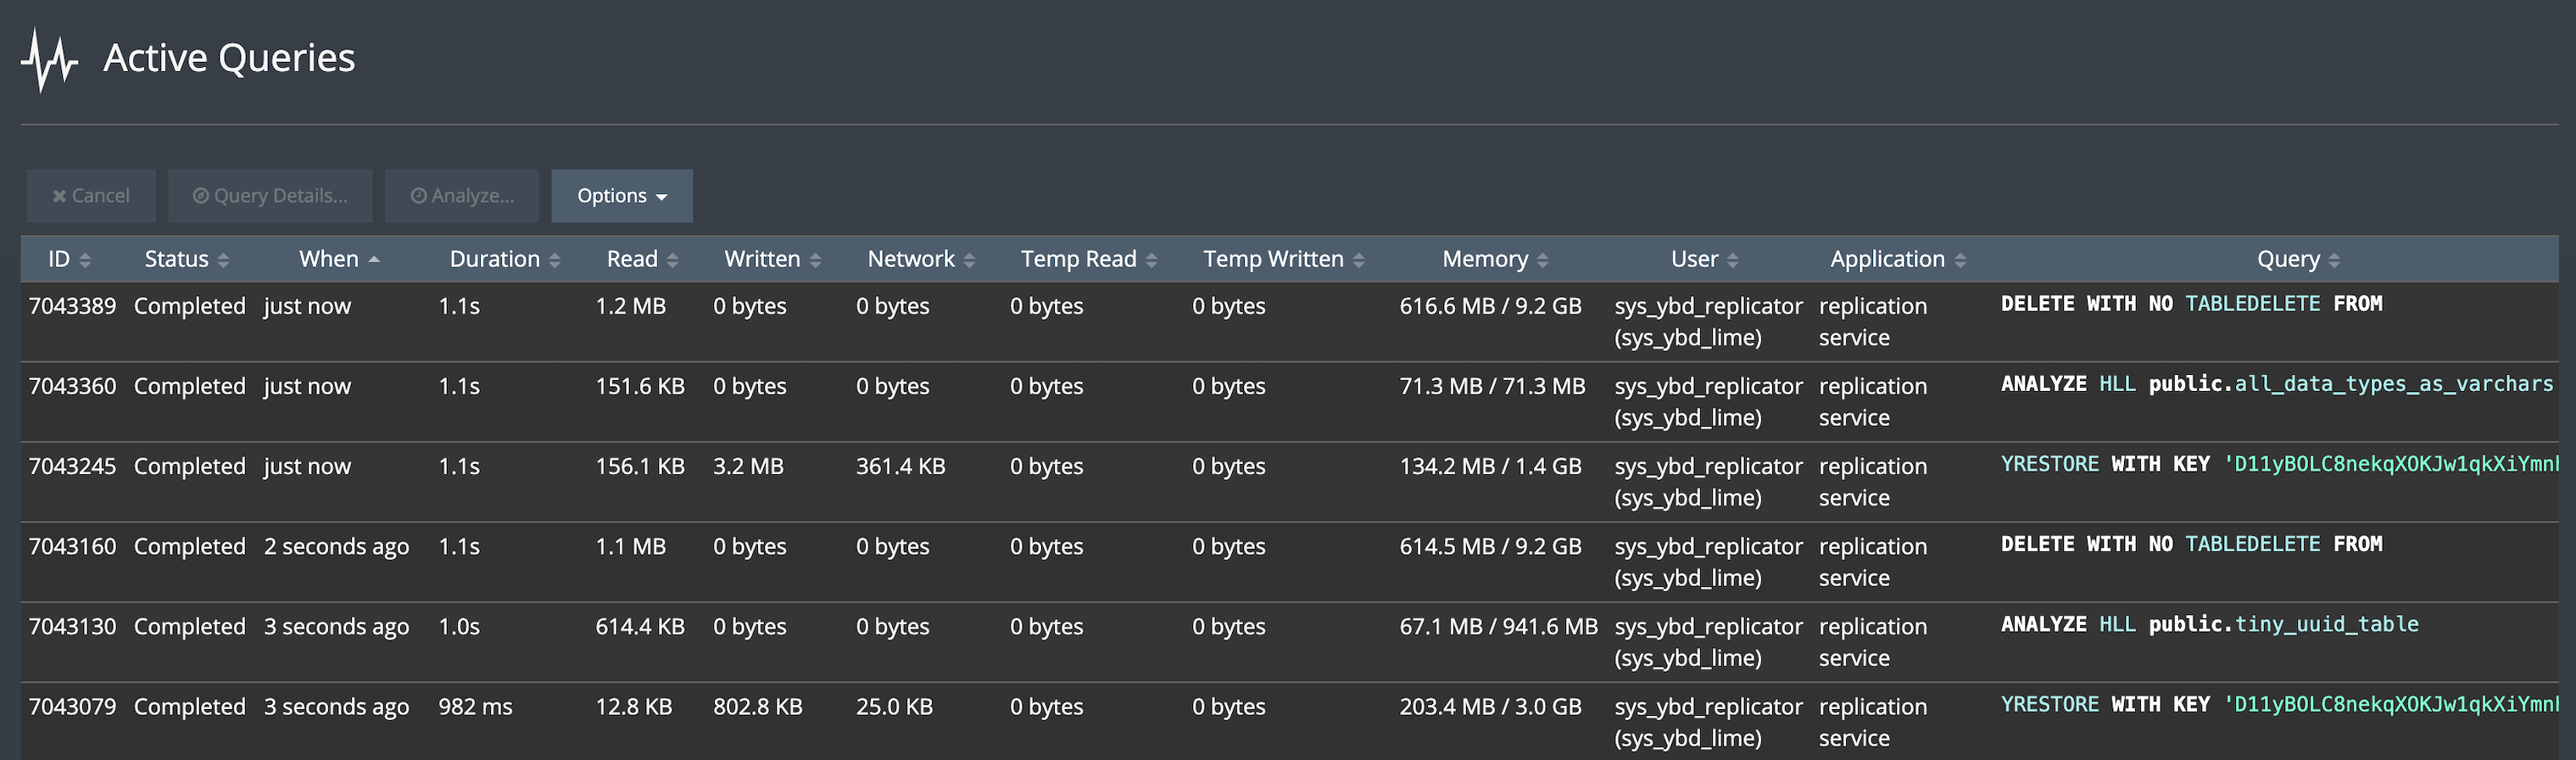
By looking at the full query text, you will be able to see how much data is being written to specific tables. Hover the mouse over the Written value to display the number of rows. For complete information about a given operation, double-click the row and look at the Query Details tabs.
System Views
Write queries against the following system views on the source system:
- sys.replica (list database replicas)
- sys.replica_status (show current state of replication activity)
- sys.log_replica_status (show the history of replication activity)
- sys.remote_server (list remote servers available for replication)
- sys.backup_snapshot (list backup snapshots)
- sys.backup_chain (list backup chains)
If you are using database replication and taking backups with ybbackup, the sys.backup_chain and sys.backup_snapshot views contain information about chains and snapshots that apply to both types of operations.
Backup and restore operations that are run for the purposes of database replication use the following application name: replication service. You can constrain rows in the sys.query, sys.log_query, sys.session, and sys.log_session views by using the following condition:
where application_name='replication service'See the view descriptions for examples.
WLM Monitoring for Replication Operations
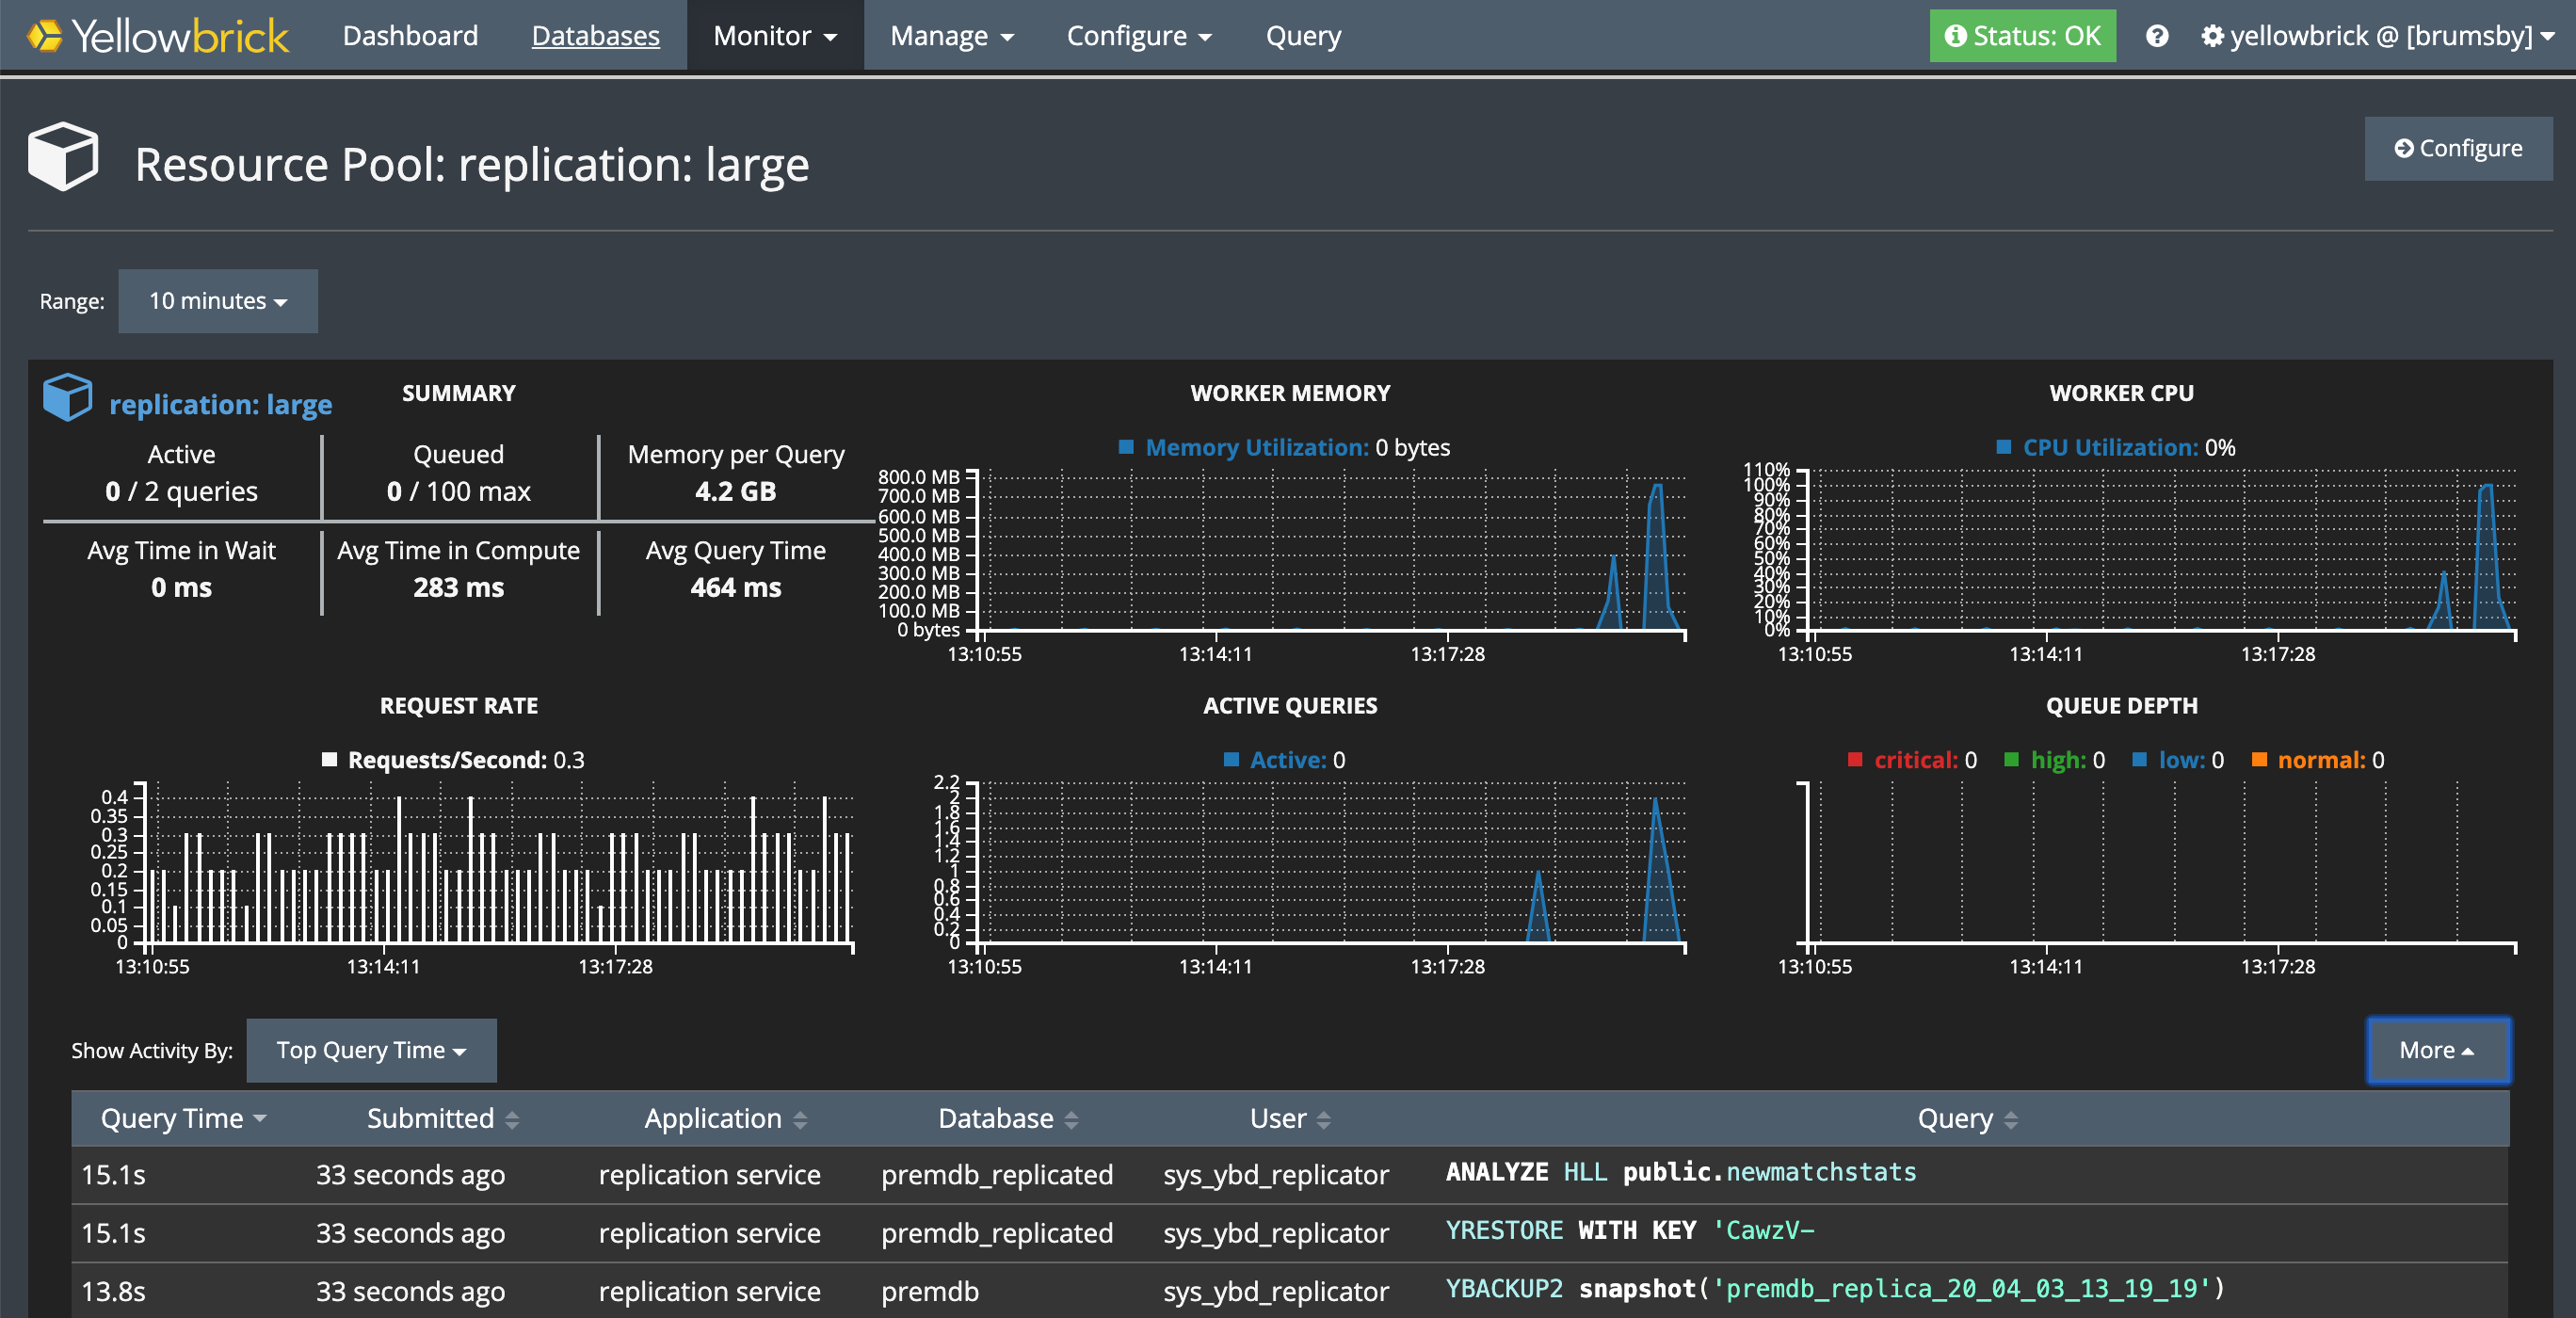
Via the SMC, you can monitor workload management (WLM) activity on both systems while replication is in progress. Go to Monitor > Resource Pools, then select the resource pool that is being used for replication.
On the source and target systems, look for operations run by the replication service application and the sys_ybd_replicator system user. For example, on a source system, you will see that a resource pool in the active WLM profile is managing replication tasks that read and send data from a specific backup snapshot to the target system.
The following example shows the monitor for a loopback replication test. Replication is running in a user-defined WLM profile called replication, using the large resource pool. Note the application name and user name.
Note: For loopback replication, make sure your active resource pool has a maximum/minimum concurrency setting of at least 2/2.
If you are not sure which resource pool is running replication operations, run a query against the sys.log_query view. For example:
premdb=# select distinct pool_id from sys.log_query
where application_name='replication service' and database_name='premdb';
     pool_id
--------------------
 replication: large
(1 row)
Parent topic:Database Replication