Appearance
Monitoring VNet Health
Yellowbrick Data Warehouse running in an Azure VNet offers the following monitoring capabilities:
- Health status in Yellowbrick Manager
- Self-service diagnostics for administrators via Yellowbrick Manager
- White-glove support for sending logs and alerts back to Yellowbrick
- Default Kubernetes monitoring features supported in Azure Portal
Health Status in Yellowbrick Manager
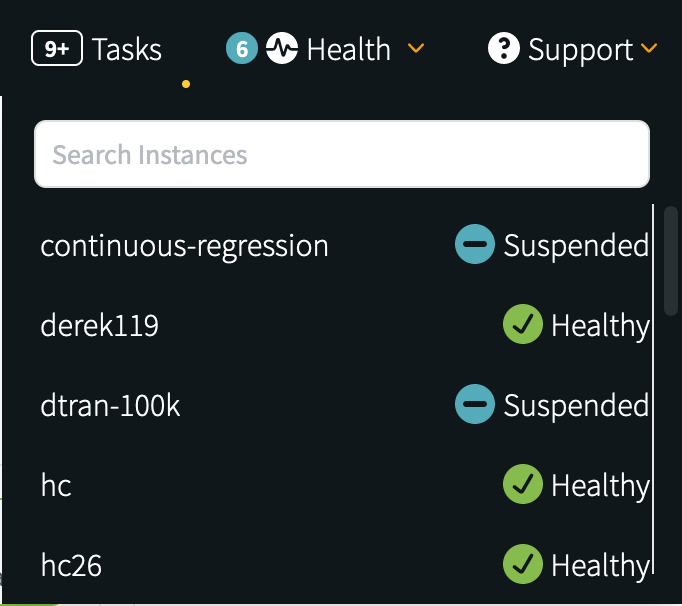
Administrators with login access to Yellowbrick Manager can instantly see the overall health of data warehouse instances in both the Health menu and the Dashboard tab.
For example, the Health menu lists the status for all instances:
The Dashboard shows the health for the current instance:
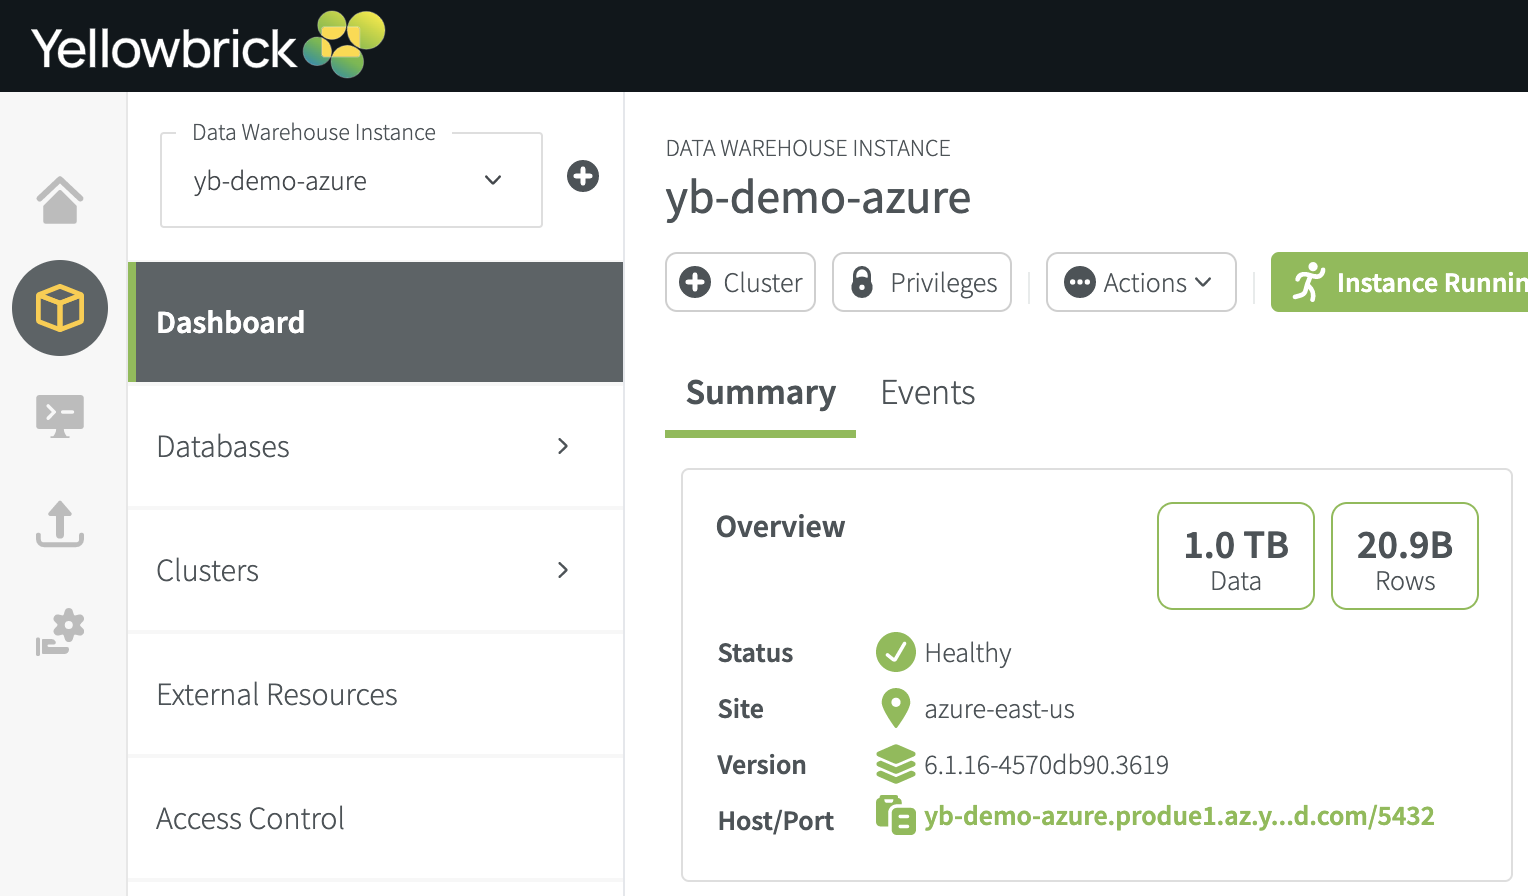
One of the following health Status values is displayed for a given instance:
- Healthy
- Suspended
- Down!
System Diagnostics
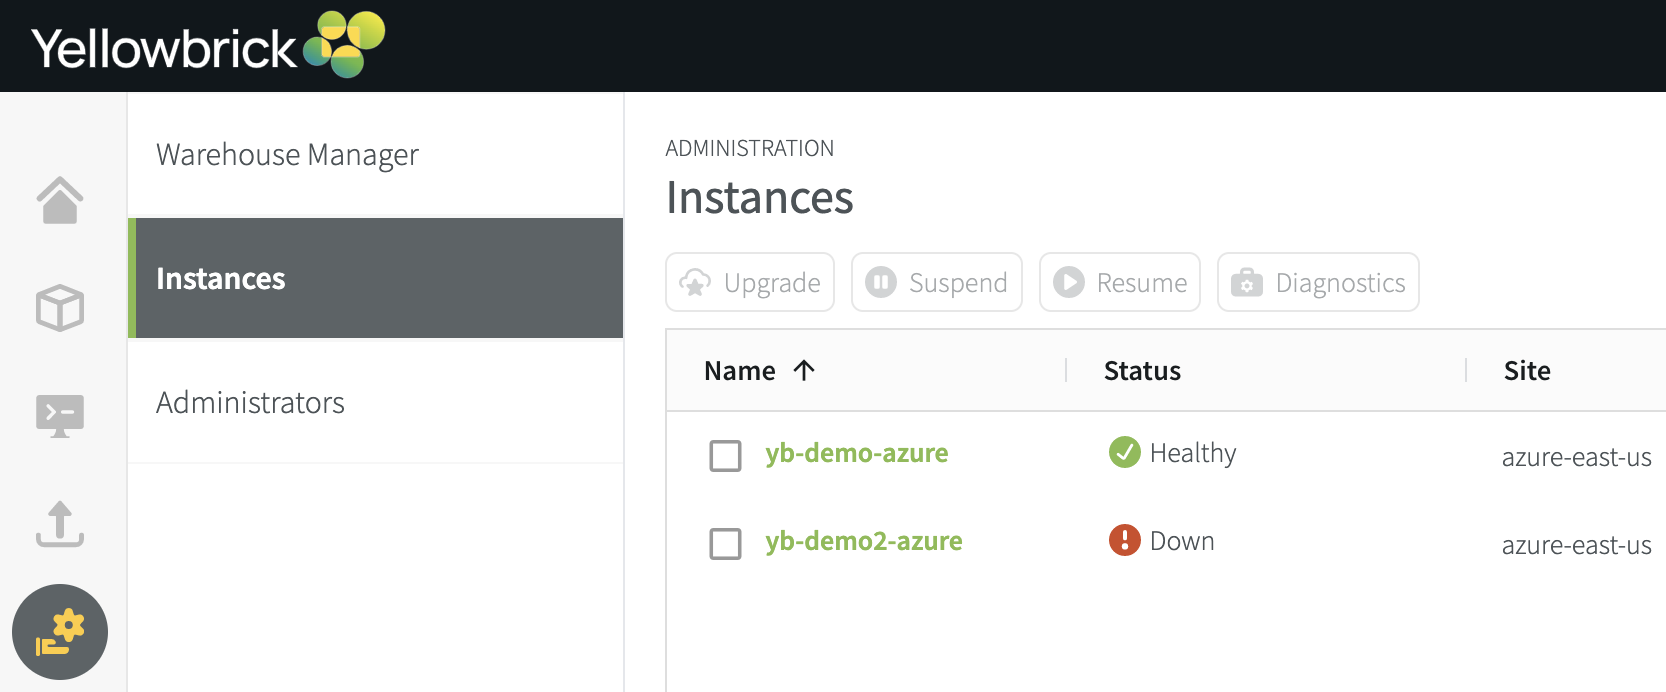
Administrators with login access to Yellowbrick Manager can go to Configuration > Instances tab at any time and run diagnostics for a specific data warehouse instance.
After selecting an instance, click the Diagnostics button:
White Glove Support
To enable additional monitoring capabilities for Yellowbrick Data Warehouse, contact the Yellowbrick Customer Support team and request white glove support. With this level of support, you can give Yellowbrick personnel immediate visibility to logs, diagnostics, and alerts generated by your data warehouse instances.
Parent topic:Azure Deployment Guide for Yellowbrick