Appearance
Metering Introduction
Yellowbrick bills customers by virtual cpu (vCPU) consumption. vCPU is consumed when a cluster is live and able to run queries.
Metering Objective
The primary goal of the metering utility is to evaluate how much time cluster is running. The customers are billed based on vCPU usage and it directly influences the overall cost. The metering also provides information on the current online capacity of the cluster and identifies the user responsible for starting the cluster.
Metering Overview
Metering is the process that takes transactional data (for example, node count, start and end time of cluster, core count, log queries) from sys schema and loads the data into respective views by performing certain operations (for example vcpu_seconds calculation) as per the business rules. Hourly bills are generated, incorporating the utilization of vcpu_seconds based on the views.
As soon as the user starts using the services (for example, if the user creates cluster, alters cluster, runs the query, or performs any activity related to the cluster) all logs get stored in the database. These logs are stored in a database named Yellowbrick inside sys schema.
Metering data is stored for a continuous year, encompassing the entirety of the present year and the preceeding 12 months (from 1st of January of the prior year). This allows users to predict usage patterns and compare the current year with previous year.
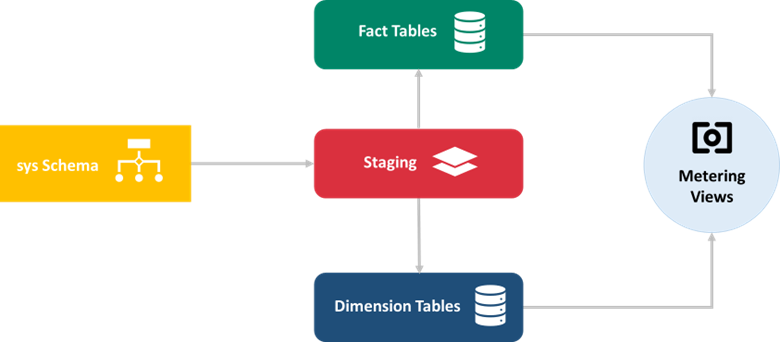
The data to be analysed from the source (
sysschema) is extracted into temporary data storage calledstaging.The data modelling (denormalising tables, cleaning up bad data, standardising data layouts and so on) is performed on staging to populate the dimension and fact tables.
In
meteringschema, we have multiple views created based on several tables fromfactanddim. These views are created by aggregating several values from the variousfactanddimtables which provide quick information about the consumption and usage of cluster vCPU and so on. This is used for billing the customers.
Terminologies
Instance
- An instance is a container of databases, users/roles, all other related data and metadata. It has an IP number, hostname and is the “service” you connect to when you connect to Yellowbrick. Each instance has a special database called
yb_meteringwhich contains all relevant billing data.
Cluster
Instances contain clusters. The users with the right privileges can create, drop, resume and suspend clusters. Clusters are “work horses” that serve queries to users. They only contain cached data and can be freely dropped and recreated without incurring data loss.
All queries executed against a Yellowbrick instance are mapped to a cluster and that cluster is responsible for doing the computational work required to respond to the query.
Node
- A cluster contains at least one node, which runs on a machine in the cloud.
Hardware Instance Type
- The type of machine that a cluster runs on is called a hardware instance. The cluster has a name that's recognised by the cloud (
cloud_provider) and it also has a name that's recognised by Yellowbrick (provider_name). The hardware instance type is recognised by combination of these two fields.
The hardware_instance_type is a sys schema view that returns a list of available hardware instance types.
| Column Name | Data Type | Description | Example |
|---|---|---|---|
hardware_instance_type_id | UUID | UUID for a hardware instance type. | 3166615f-fe48-4d82-882b-8300dc963a4e |
cloud_provider | VARCHAR | Which cloud provider? | azure |
cloud_region | VARCHAR | Which cloud region is the instance type in? | east-us |
hardware_instance_name | VARCHAR | Name of the hardware instance. | small-v1 |
provider_name | VARCHAR | Provider name for the instance type. | Standard_L16s_v3 |
ram_bytes | BIGINT | Amount of RAM allocated to this instance type, in bytes. | 107374182400 |
vcpu_cores | INTEGER | Number of virtual CPU cores per node. | 16 |
cpu_cores | INTEGER | Number of CPU cores per node. | 8 |
network_access | VARCHAR | accel_udp | |
storage_access | VARCHAR | accel_nvme | |
storage_size_bytes | BIGINT | Size of data storage, in bytes. | 3958241859994 |
is_system | BOOLEAN | Whether this instance type was created by the system. | TRUE |
vcpu_cores
A hardware instance type contains
vcpu_cores. Depending on cloud provider, the number ofvcpu_coresmay vary.For example,
- In Azure,
- A small v1 cluster with one node has 16
vcpu_cores. - A large v1 cluster with one node has 80
vcpu_cores.
- A small v1 cluster with one node has 16
- In AWS,
- A small v1 cluster with one node has 16
vcpu_cores. - A large v1 cluster with one node has 96
vcpu_cores.
- A small v1 cluster with one node has 16
- In Azure,
vcpu_seconds
A vCPU second is one CPU core online, for one second. Fractional seconds consumed are rounded up (for example, consuming 1.5 seconds of 1 CPU core online counts as 2
vcpu_secondsconsumed). The vCPU usage is unaffected by the type of vCPU you deploy in the cluster.vcpu_secondscalculation is based on the number of cores in the hardware instance. For example, A query running for 5 seconds on the instance with a small cluster (1 node with 16 cores) should calculatevcpu_secondsas 5x1x16 = 80 sec.
vcpu_estimate
- Running queries does not directly consume vCPU. The customers are only billed for the cluster being online, not by the queries that run on that cluster. However, it can be useful to understand what queries are consuming the most CPU so you can properly scale the running clusters and optimise
vcpu_seconds.
Metering Views
The
meteringschema views allow customers to query how they will be billed. It also measures which users and clusters consume the most vCPU and when that vCPU was consumed. The views are located in theyb_meteringsys database.metering.vcpu_consumption - contains the
vcpu_secondsused for billing.metering.vcpu_estimate_per_query - contains the
vcpu_estimatefor the queries using the most vCPU on a running cluster.
The metering scehma views can be queried directly with SQL or data can be extracted to reporting tools.
In This Section