Appearance
Managing Alerts
To manage active and logged alerts, you can use the SMC views, or you can query system views.
SMC Views
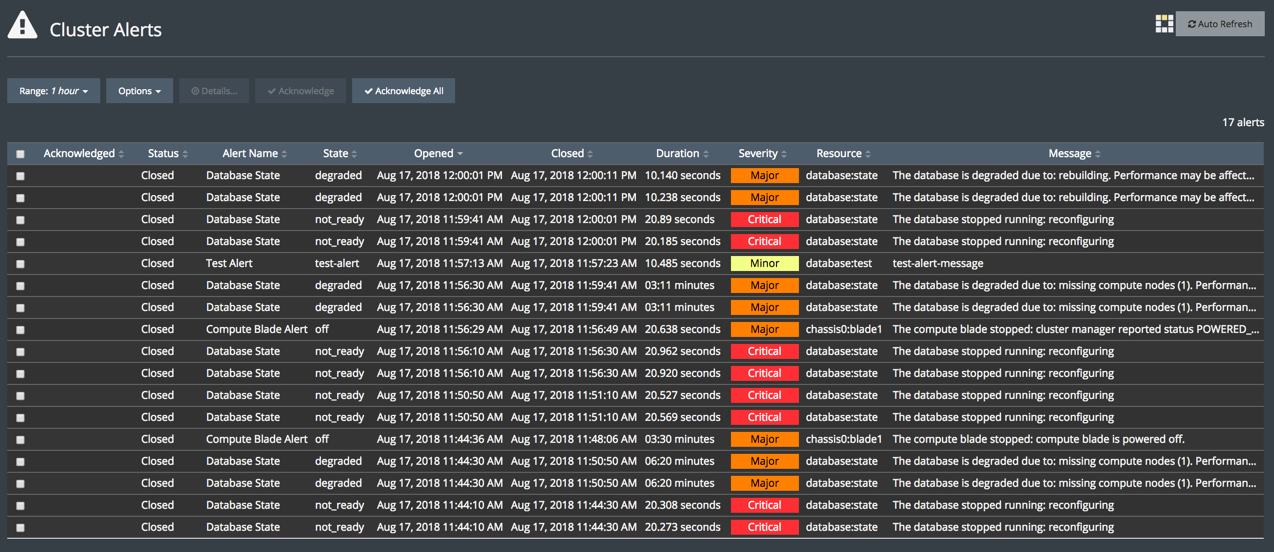
Go to Manage > Cluster Alerts. To change the display, click Options. For example:
Go to Configure > Alerting > Endpoints to see a quick summary of the number of alerts that have been processed recently or that have failed with errors. For example:
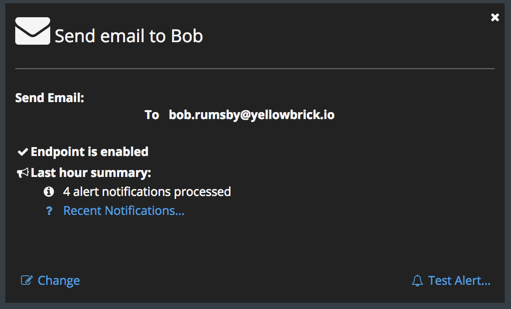
You can click Recent Notifications to see a list of recent alert messages for that endpoint.
System Views
To see active alerts (alerts in OPEN state), query the sys.alert view. For example:
yellowbrick=# select * from sys.alert;
-[ RECORD 1 ]-----+--------------------------------------------------------
alert_id          | c3346760-51c9-4b23-b5b7-bcb1cc00d262
alert_name        | Power Supply Alert
open_time         | 2018-08-16 15:32:34-07
close_time        | [NULL]
last_update_time  | 2018-08-16 15:32:34-07
duration_ms       | 74426598.612
resource          | chassis0:power4
severity          | CRITICAL
status            | OPEN
state             | error
message           | The power supply stopped: power supply status is error.
acknowledged      | f
acknowledged_time | [NULL]
acknowledged_by   | [NULL]
acknowledged_text | [NULL]
...
To see all logged alerts that have been CLOSED and any alerts that remain OPEN, query the sys.log_alert view. For example:
yellowbrick=# select * from sys.log_alert;
-[ RECORD 1 ]-----+-----------------------------------------------------------------------------------------
alert_id          | 180f13ae-3d4d-4452-9433-e44b1673b6c1
alert_name        | Database State
open_time         | 2018-08-14 01:16:37-07
close_time        | 2018-08-14 01:16:51.073-07
last_update_time  | 2018-08-14 01:16:51-07
duration_ms       | 14073.000
resource          | database:state
severity          | CRITICAL
status            | CLOSED
state             | offline
message           | The database stopped running: not enough compute nodes to start
acknowledged      | f
acknowledged_time | [NULL]
acknowledged_by   | [NULL]
acknowledged_text | [NULL]
-[ RECORD 2 ]-----+-----------------------------------------------------------------------------------------
alert_id          | bdf4f281-5eec-4321-81a2-a3dc20b49178
alert_name        | Database State
open_time         | 2018-08-14 01:16:51-07
close_time        | 2018-08-14 01:18:59.148-07
last_update_time  | 2018-08-14 01:18:59-07
duration_ms       | 128148.000
resource          | database:state
severity          | INFORMATIONAL
status            | CLOSED
state             | stopped
message           | The database was stopped by an administrator
acknowledged      | f
acknowledged_time | [NULL]
acknowledged_by   | [NULL]
acknowledged_text | [NULL]
...
Parent topic:System Alerts