Appearance
EXPLAIN
Return the text version of the query plan for either a specific SELECT query or a statement that runs a query.
Use the SMC to see a graphical version of the plan.
Syntax
EXPLAIN ( [ ANALYZE ] [ , VERBOSE ] [ , STABLE ] [ , TYPE ] ) query- ANALYZE
Run the query and return both the query plan and execution details. Runtime statistics are reported, including rows returned, execution time (in milliseconds), memory use, and cache hits. The read efficiency statistic is a percentage that describes how effective the execution engine was in not reading rows from the storage engine early in the plan. A value of 0% means that no rows were discarded in this way. A high value means that the system was very efficient and incurred less I/O. Sorting a table on a column that is frequently constrained may influence read efficiency.
If you do not specify this option, EXPLAIN returns the query plan without running the query.
Warning: Running
EXPLAIN ANALYZEon anINSERT,UPDATE, orDELETEstatement modifies the target table, without warning. To avoid this problem, you can run theEXPLAIN ANALYZEstatement inside a transaction, then roll it back if needed. See EXPLAIN ANALYZE for a DELETE.- VERBOSE
Return a more detailed plan output. You can use this option with or without
ANALYZEand/orSTABLE.- STABLE
Strip out details that might vary in the plan. Only the basic structure of the plan is rendered, regardless of actual statistics. You can use this option to isolate real differences between plans when the same query is run multiple times under different conditions. You can use this option in conjunction with
VERBOSEand/orANALYZE.Note:
LIMITqueries that do not have anORDER BYclause are non-deterministic; therefore, using theSTABLEoption for these queries is not recommended.- TYPE
Return the data types for the columns in the output.
- query
Any valid Yellowbrick query. You can run the EXPLAIN command on all of the following query statements:
- SELECT
- SELECT INTO
- CREATE TABLE AS (CTAS)
- INSERT
- UPDATE
- DELETE
You cannot run the EXPLAIN command on a TRUNCATE statement.
Return the plan for a SELECT * query
premdb=# explain select * from awayteam;
                          QUERY PLAN
----------------------------------------------------------------
 id   rows_planned   workers   node
  0             50    single   SELECT
                                (awayteam.atid, awayteam.name)
                                distribute none
  2             50    single   SCAN awayteam
                                (awayteam.atid, awayteam.name)
                                distribute single

(8 rows)
Run the same query and return both the plan and statistics
premdb=# explain (analyze) select * from awayteam;
                                    QUERY PLAN
-------------------------------------------------------------------------------------
 Planning time: 0.069 ms
 id   rows_planned   rows_actual   skew    memory   workers   node
  0             50            50   0.00   512.14k    single   SELECT
                                                               distribute none
  2             50            50   0.00    20.00k    single   SCAN awayteam
                                                               distribute single
                                                               read_efficiency=0.0%
 50 rows returned, read 0.05MB, distributed 0.00MB, memory used 12.58MB
 Code cache hits: 0/2, lookup cache hit: false
 Execution time: 563.696 ms
(10 rows)
Run the same query and add the VERBOSE option
premdb=# explain (analyze, verbose) select * from awayteam;
                                         QUERY PLAN
-----------------------------------------------------------------------------------------------
 Planning time: 0.062 ms
 id   rows_planned   rows_actual   skew    memory   workers   node
  0             50            50   0.00   256.14k    single   SELECT
                                                               (awayteam.atid, awayteam.name)
                                                               distribute none
  2             50            50   0.00    20.00k    single   SCAN awayteam
                                                               (awayteam.atid, awayteam.name)
                                                               distribute single
                                                               read_efficiency=0.0%
 50 rows returned, read 0.05MB, distributed 0.00MB, memory used 12.58MB
 Code cache hits: 1/1, lookup cache hit: false
 Execution time: 20.513 ms
(12 rows)
Return the plan for a query that filters rows returned from a sorted table
Note the read efficiency statistic in this example. (The table newmatchstats is sorted on seasonid.)
premdb=# explain (analyze) select * from newmatchstats where seasonid=10;
                                                 QUERY PLAN
---------------------------------------------------------------------------------------------------------------
 Planning time: 0.091 ms
 id   rows_planned   rows_actual   skew   memory   workers   node
  0          34200         34200   0.00    1.00M       all   SELECT
                                                              distribute none
  2          34200         34200   0.00   36.00k       all   SCAN newmatchstats
                                                              distribute on (newmatchstats.seasonid)
                                                              scan_constraints: (newmatchstats.seasonid = $0)
                                                              read_efficiency=41.0%
 34200 rows returned, read 1.49MB, distributed 0.75MB, memory used 14.68MB
 Code cache hits: 0/2, lookup cache hit: false
 Execution time: 705.108 ms
(11 rows)
Use the STABLE option on the previous query
premdb=# explain (analyze, stable) select * from newmatchstats where seasonid=10;
                               QUERY PLAN
---------------------------------------------------------------------------
 Planning time: 0.112 ms
 rows_actual   workers   node
      34200       all   SELECT
                          distribute none
      34200       all   SCAN newmatchstats
                          distribute on (newmatchstats.seasonid)
                          scan_constraints: (newmatchstats.seasonid = $0)
 34200 rows returned
(8 rows)
Add the TYPE option to the previous query
premdb=# explain (analyze, stable, type) select * from newmatchstats where seasonid=10;
                                                                              QUERY PLAN
-------------------------------------------------------------------------------------------------------------------------------------------------------------------------
 rows_actual   workers   node
      34200       all   SELECT
                          (newmatchstats.seasonid INT2, newmatchstats.matchday DATE, newmatchstats.htid INT2, newmatchstats.atid INT2, newmatchstats.moment VARCHAR(5))
                          distribute on (newmatchstats.seasonid)
      34200       all   SCAN newmatchstats
                          (newmatchstats.seasonid INT2, newmatchstats.matchday DATE, newmatchstats.htid INT2, newmatchstats.atid INT2, newmatchstats.moment VARCHAR(5))
                          distribute on (newmatchstats.seasonid)
                          scan_constraints: (newmatchstats.seasonid = $0)
 34200 rows returned
(9 rows)
EXPLAIN ANALYZE for a DELETE
This example shows the behavior to expect when you use the ANALYZE option on a statement that writes data. In this case, three rows are deleted from the season table. If you run this type of EXPLAIN command but do not want to delete, insert, or update the data permanently, wrap the EXPLAIN ANALYZE statement inside a transaction so that the changes can be rolled back.
premdb=# select count(*) from season;
 count
-------
   25
(1 row)

premdb=# explain analyze delete from season where winners='Arsenal';
                                                        QUERY PLAN
----------------------------------------------------------------------------------------------------------------------------
 Planning time: 0.265 ms
 id   rows_planned   rows_actual   skew   workers   node
  3              3             3   0.54    single   DISTRIBUTE RANDOM
  4              3             3   1.00    single   DELETE FROM season
  5              3             3   1.00       all   DISTRIBUTE WORKER
  7              3             3   0.00       all   SCAN season
                                                     season.winners = $0 AND scan_constraints: (season.winners = $0)
                                                     read_efficiency=0.0%, rows_from_column_store=3, rows_from_row_store=0
 3 rows deleted
 Read: 1.52MiB, Distributed: 72.00B, Write: 240.00kiB
 Database: premdb
 Version: 5.3.4-20211123225935
 Hostname: yb04-mgr0.yellowbrick.io
 query_id: 5249610
 Lookup cache hit: false
 Code cache hit: true
 Execution time: 128.120 ms, End time: 2021-11-29 14:58:35
(17 rows)

premdb=# select count(*) from season;
 count
-------
   22
(1 row)
SMC Graphical EXPLAIN
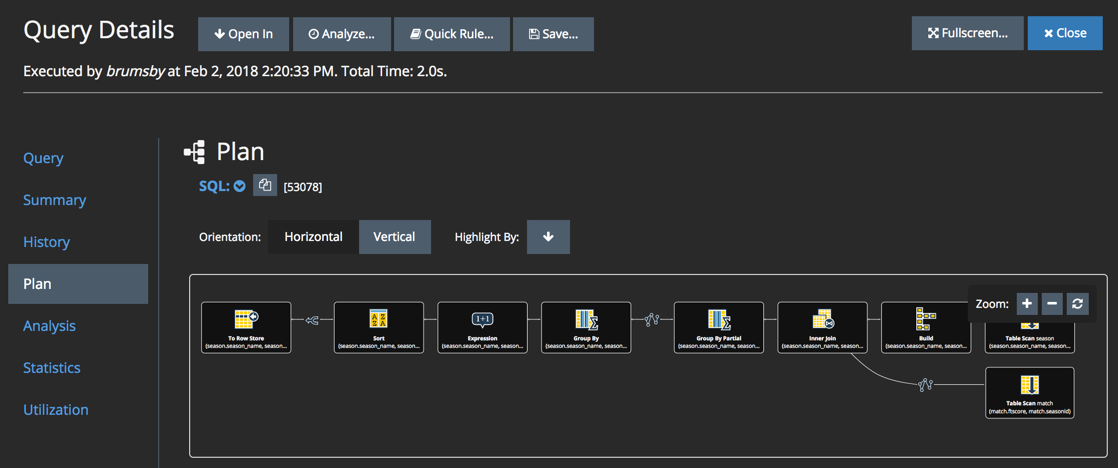
Tip: You may also want to use the visual EXPLAIN feature in the System Management Console (SMC). After logging in, go to Monitor, then Active Queries or Query Performance, double-click the query you want to explain, and click Plan. For example:
Parent topic:SQL Commands