Appearance
Chassis Management
The Chassis Manager page displays the real-time status of each hardware component in the appliance (in the SMC, go to Manage > Chassis). You can use this page to monitor the current state of the appliance and investigate error conditions.
Note: Your Yellowbrick appliance may be a single-chassis or dual-chassis system. The examples in this section describe a dual-chassis system.
The Chassis Manager page has four main tabs.
Compute Blades
This tab provides a graphical view to assess the overall status of each compute blade on each chassis in the appliance, with information on both the physical status and power status:
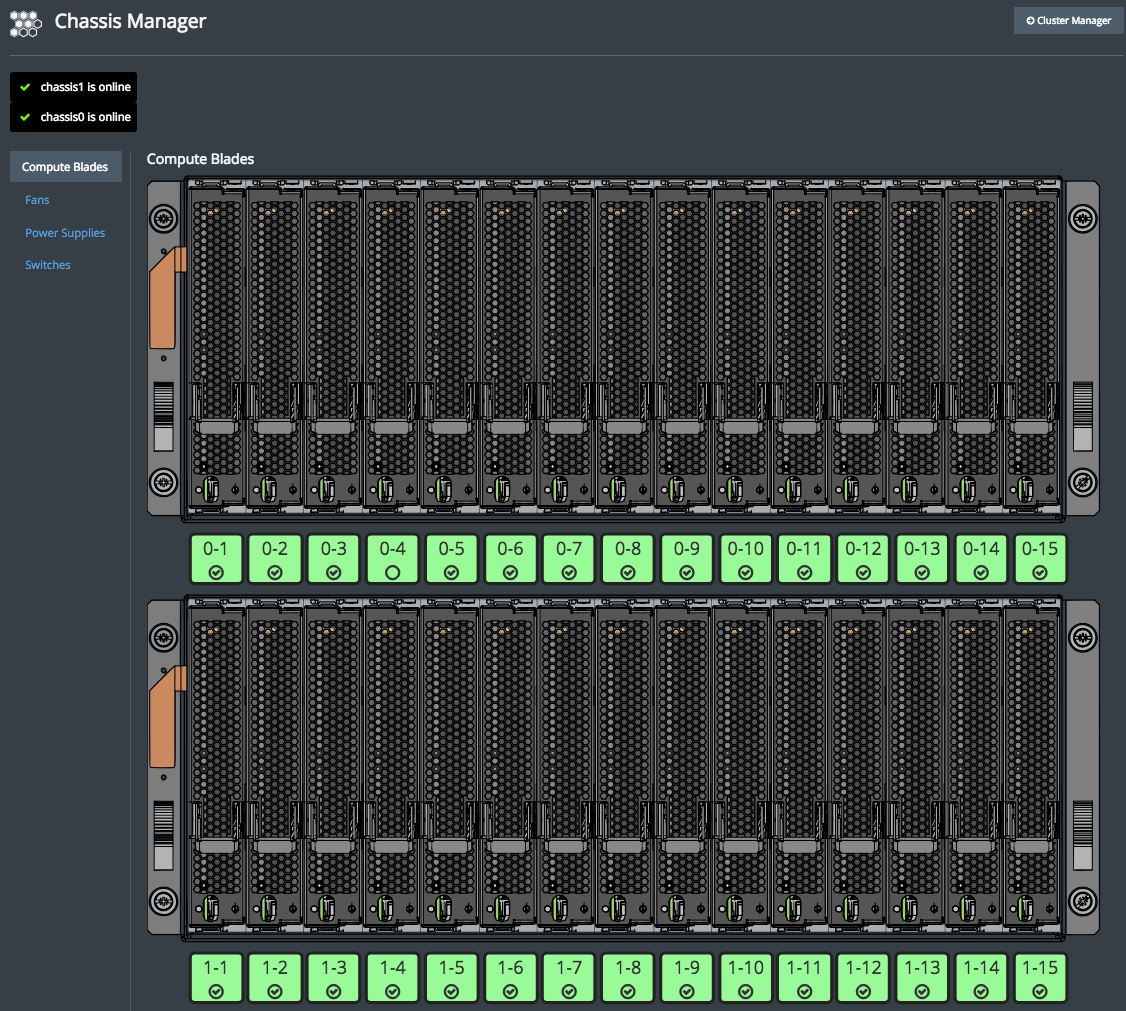
Each vertical image displays the status of a single compute blade as it is physically inserted into an appliance chassis. This example shows a dual-chassis appliance. Each compute blade image provides information on its physical state, power status, light status, and software configuration status.
Physical Status and Power Status
The graphical image of the compute blades provides information on both the physical status and power status:
| Graphic | Physical Status | Power Status |
|---|---|---|
| Image as shown above | Blade inserted | On |
| Image above with dark gray background | Blade inserted | Off |
| Image above as yellow | Blade inserted, powered on, being updated to match the cluster version level | On |
| Flat gray image (no graphic) | No blade inserted | N/A |
LED Light Status
At the top of each compute blade image, the LED light status is shown. This status matches the physical LED lights that are visible when you look at the front of the appliance itself. Each blade has three LED lights: green, red, and blue. The states of each light are: Off, On, Fast blink, Slow blink. The meaning of each light status is as follows:
| LED Light Status | Description |
|---|---|
| All off | Power off |
| All fast blinking | Power on, blade starting |
| All slow blinking | Power on, OS or software worker booting |
| Green on | Power on, booted |
| Red on | Hardware error |
| Blue on | Beacon activated |
During normal operation, the green LED light is on. If the compute blade experiences a hardware error, the red LED light will turn on.
The blue LED light is a beacon light for administration purposes. Administrators can manually turn the blue beacon light on or off in either the Cluster Manager SMC page or by using the ybcli blade command. Turning on the beacon light visually indicates which compute blade needs servicing or replacement, avoiding operator errors during service events.
Note: On the real physical compute blades, there is an additional LED light at the bottom of each blade. This light, when flashing, indicates storage I/O activity. However, on this SMC page the light is shown statically as always on and simply shows the light’s physical position.
Compute Blade Software Status
The graphical box below each compute blade (the green boxes in the screen capture) provides information on the software status for each blade. There are two indicators: the color of the box and the icon that is shown.
- Color Indicator
- |Color|Description| |-----|-----------| |Green|Software worker online| |Red|Software worker in error state| |Dark gray|Software worker offline| |Light gray|Compute blade physically removed| |Blue|New compute blade physically inserted but not added to the cluster|
- Icon Indicator
- |Icon|Description| |----|-----------| |Circle with checkbox|Software worker registered OK| |Circle with no checkbox|Software worker registered as spare| |Circle with
X|Cluster unable to communicate with software worker on compute blade| |Triangle with!|Software worker in error state|
Fans
This tab shows the status of each fan in the appliance.
The appliance has 5 fan slots that are hot-swappable, and each fan slot contains 2 fans. Fans are redundant and provide n+2 protection by slots. For example:
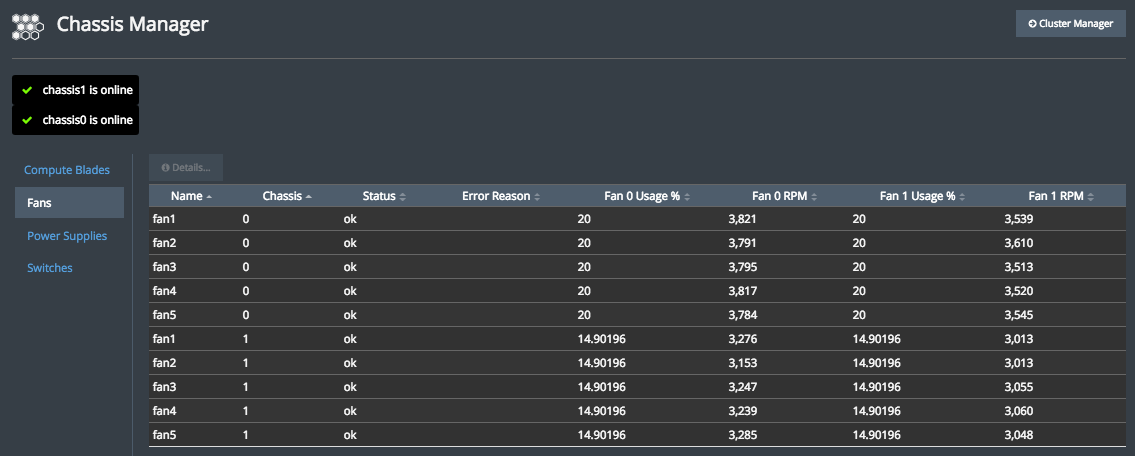
The following table describes the information on the Fans tab:
| Column | Description |
|---|---|
| Name | The physical fan slot |
| Chassis | Chassis number (0 or 1). |
| Status | Current status |
| Error Reason | Description if in error state |
| Fan 0 Usage % | For the 1st fan, the current % of max RPM |
| Fan 0 RPM | For the 1st fan, the current RPM |
| Fan 1 Usage % | For the 2nd fan, the current % of max RPM |
| Fan 1 RPM | For the 2nd fan, the current RPM |
Power Supplies
This tab shows the status of each power supply in the appliance. Appliances may have 2 to 4 power supplies per chassis depending on the number of compute blades that are installed. Power supplies are redundant and provide n+2 protection in 15-node configurations. Information on the status, manufacturer and model, and current power consumption, amps, and voltages is provided. For example:
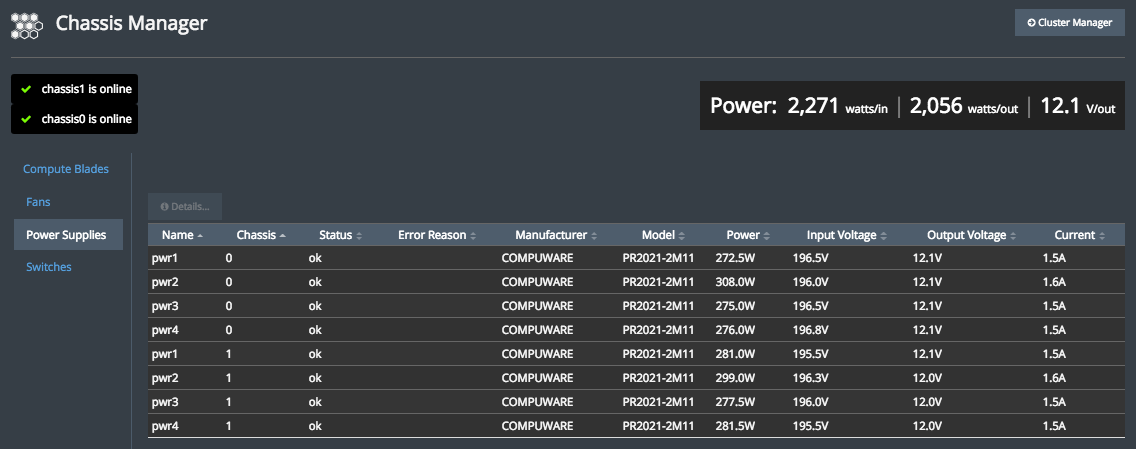
Additionally, the current power consumption of the appliance is summarized at the top of the page. This power consumption is just for the compute blade chassis and does not include power drawn from the two manager nodes.
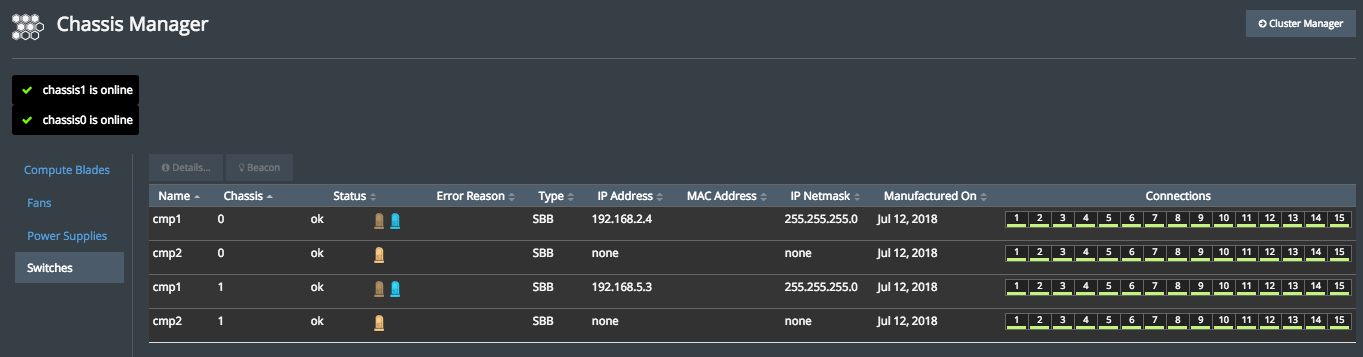
Switches
This page shows the status of each internal InfiniBand switch in the appliance. Appliances contain 2 HA redundant InfiniBand networks per chassis, with one in the active state and the other in standby state. The status, error reason, IP address, and port connections to each blade are listed. For example:
Parent topic:System Management