Appearance
Metering Use Cases
The metering scenarios within this file serve as a reference.
Scenario 1: Single Cluster Running
Description:
The cluster C1 undergoes multiple resumptions and suspensions within a one-hour timeframe, persisting in the running state even beyond the one-hour period.

Preconditions:
- Valid user credentials.
- Operational system.
Sample Query:
sql
SELECT metering_hour, SUM(vcpu_seconds) AS vcpu
FROM metering.vcpu_consumption
GROUP BY 1
Expected Outcome:
The bill gets split into two segments, one for the initial hour and another for subsequent hour. All metering is aggregated to the hour level.
Scenario 2: Multiple Clusters Running Simultaneously
Description:
Multiple clusters C1 and C2 are running simultaneously.

Preconditions:
- Valid user credentials.
- Operational system.
Sample Query:
sql
SELECT metering_hour, cluster_name, SUM(vcpu_seconds) AS vcpu
FROM metering.vcpu_consumption
GROUP BY 1,2
Expected Outcome:
The bill for both C1 and C2 clusters is calculated by aggregating the runtime of both clusters (C1+C2) for the inital hour and for subsequent hour (C2+part of C1 overlapping in second hour).
You can break down the bill into each cluster by aggregating on the cluster_name column.
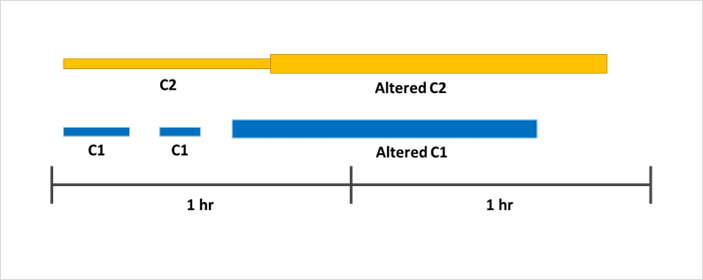
Scenario 3: Altered Clusters
Description:
The cluster can be altered while it is suspended or also while it is running. Cluster C1 gets altered when suspended however C2 gets altered while running. The alteration changes the instance type
Preconditions:
- User permissions to alter the cluster.
- Valid user credentials.
- Operational system.
Sample Query:
sql
SELECT metering_hour, cluster_name, yb_instance_name, SUM(vcpu_seconds) AS vcpu
FROM metering.vcpu_consumption
GROUP BY 1, 2, 3
Expected Outcome:
The bill generated is different for the cluster before and after alteration, but they get aggregated in every hour cycle. The bill is also broken down by the instance used
Scenario 4: Identify Users Utilising Queries With The Highest "vcpu Consumption"
Description:
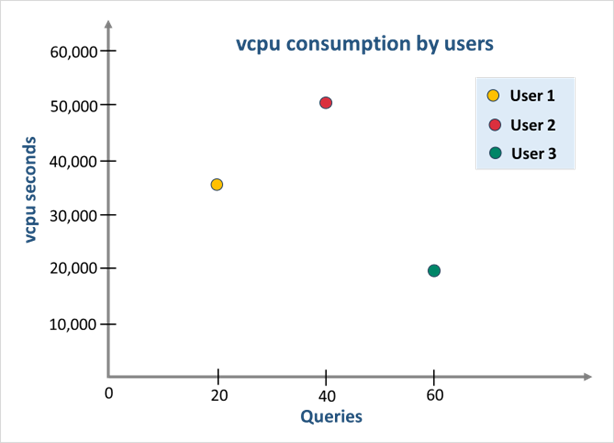
For billing, the information about the top users that are consuming the most vcpu_estimate_seconds can be obtained using a query. Also additional information such as number of queries each user has executed, cluster name and cluster id for each of the users can be seen.
The vcpu_estimate_seconds consumed is not directly proportional to the number of queries executed by the user. It may vary based on the complexity of the query. For instance, in the graph below, User 2 ran fewer queries than User 3, but the vCPU consumption for User 2 is higher than that for User 3.
Preconditions:
- Valid user credentials.
- Operational system.
Sample Query:
sql
SELECT username
  , count(query_id) AS total_queries
  , sum(vcpu_estimate_seconds) AS total_vcpu_seconds
FROM metering.vcpu_estimate_per_query
GROUP BY 1
ORDER BY 3 DESC;
Expected Outcome:
The names of users gets displayed in the descending order based on the consumption of vcpu_estimate_seconds from metering.vcpu_estimate_per_query view.
Note: The top 100 queries based on maximum execution time (run_ms) are available.