Appearance
EXPLAIN
Return the text version of the query plan for a SELECT query statement, a SQL statement that runs a query, or a running query identified by its query ID.
Syntax
EXPLAIN ( [ ANALYZE ] [ , VERBOSE ] [ , STABLE ] [ , TYPE ] [ , NODE_OUTPUT ] [ , DISTRIBUTION ] [ , PARTITIONS ]) query | query_id- ANALYZE
Run the query and return both the query plan and execution details. Runtime statistics are reported, including rows returned, execution time (in milliseconds), memory use, and cache hits. The read efficiency statistic is a percentage that describes how effective the execution engine was in not reading rows from the storage engine early in the plan. A value of 0% means that no rows were discarded in this way. A high value means that the system was very efficient and incurred less I/O. Sorting a table on a column that is frequently constrained may influence read efficiency.
If you do not specify this option, EXPLAIN returns the query plan without running the query.
Warning: Running
EXPLAIN ANALYZEon anINSERT,UPDATE, orDELETEstatement modifies the target table, without warning. To avoid this problem, you can run theEXPLAIN ANALYZEstatement inside a transaction, then roll it back if needed.- VERBOSE
Return a more detailed plan output. You can use this option with or without
ANALYZEand/orSTABLE.- STABLE
Strip out details that might vary in the plan. Only the basic structure of the plan is rendered, regardless of actual statistics. You can use this option to isolate real differences between plans when the same query is run multiple times under different conditions. You can use this option in conjunction with
VERBOSEand/orANALYZE.Note:
LIMITqueries that do not have anORDER BYclause are non-deterministic; therefore, using theSTABLEoption for these queries is not recommended.- TYPE
Return the data types for the columns in the output.
- NODE_OUTPUT
Return the list of columns that are projected from each plan node.
- DISTRIBUTION
Return distribution information for each plan node.
- PARTITIONS
Return information about partitioned table columns when the plan uses partitioned execution.
- query
Any valid Yellowbrick query. You can run the EXPLAIN command on all of the following SQL statements:
- SELECT
- SELECT INTO
- CREATE TABLE AS (CTAS)
- INSERT
- UPDATE
- DELETE
You cannot run the EXPLAIN command on a TRUNCATE statement.
- query_id
Return EXPLAIN output for a query that is currently running. Specify the query by using the
query_idvalue from thesys.queryview.
Return the plan for a SELECT * query
premdb=# explain select * from awayteam;
                  QUERY PLAN
------------------------------------------------
 id   rows_planned   workers   node
  1             50    single   SELECT
  3             50    single   SCAN awayteam
 Database: premdb
 Version: 5.1.0-20201008122214
 Hostname: yb007-mgr0.yellowbrick.io

(7 rows)
Run the same query and return both the plan and statistics
premdb=# explain (analyze) select * from awayteam;
                                                        QUERY PLAN
-----------------------------------------------------------------------------------------------------------------------------
 Planning time: 0.140 ms
 id   rows_planned   rows_actual   skew   workers   node
  1             50            50   0.00    single   SELECT
  3             50            50   0.00    single   SCAN awayteam
                                                     read_efficiency=0.0%, rows_from_column_store=50, rows_from_row_store=0
 50 rows returned
 Read: 40.00kiB, Distributed: 893.00B
 Database: premdb
 Version: 5.1.0-20201008122214
 Hostname: yb007-mgr0.yellowbrick.io
 query_id: 2859092
 Lookup cache hit: false
 Code cache hit: false
 Execution time: 665.396 ms, End time: 2020-11-02 12:10:48
(14 rows)
Run the same query and add the NODE_OUTPUT option
premdb=# explain (analyze, node_output) select * from awayteam;
                                                        QUERY PLAN
-----------------------------------------------------------------------------------------------------------------------------
 Planning time: 0.185 ms
 id   rows_planned   rows_actual   skew   workers   node
  1             50            50   0.00    single   SELECT
                                                     (awayteam.atid, awayteam.name)
  3             50            50   0.00    single   SCAN awayteam
                                                     (awayteam.atid, awayteam.name)
                                                     read_efficiency=0.0%, rows_from_column_store=50, rows_from_row_store=0
 50 rows returned
 Read: 40.00kiB, Distributed: 893.00B
 Database: premdb
 Version: 5.1.0-20201008122214
 Hostname: yb007-mgr0.yellowbrick.io
 query_id: 43353441
 Lookup cache hit: false
 Code cache hit: true
 Execution time: 27.893 ms, End time: 2020-12-14 12:47:16
(16 rows)
Run the same query and add the VERBOSE option
premdb=# explain (analyze, node_output, verbose) select * from awayteam;
                                                                      QUERY PLAN
--------------------------------------------------------------------------------------------------------------------------------------------------------
 Planning time: 0.178 ms
 id   rows_planned   rows_actual   skew   mem_planned   mem_actual   workers   node
  1             50            50   0.00      8.00Mi H     256.14ki    single   SELECT
                                                                                (awayteam.atid, awayteam.name)
                                                                                distribute single
  3             50            50   0.00     57.00Mi H       1.00Mi    single   SCAN awayteam
                                                                                (awayteam.atid, awayteam.name)
                                                                                distribute single
                                                                                read_efficiency=0.0%, rows_from_column_store=50, rows_from_row_store=0
 50 rows returned
 Memory planned (fixed): 71.00MiB, Memory planned (variable): 128.00MiB, High confidence, Memory actual: 16.00MiB
 Read: 40.00kiB, Distributed: 893.00B
 Database: premdb
 Version: 5.1.0-20201008122214
 Hostname: yb007-mgr0.yellowbrick.io
 query_id: 43353867
 Lookup cache hit: false
 Code cache hit: true
 Execution time: 30.014 ms, End time: 2020-12-14 12:48:04
(19 rows)
Return the plan for a query that filters rows returned from a sorted table
Note the read efficiency statistic in this example. (The table newmatchstats is sorted on seasonid.)
premdb=# premdb=# explain (analyze) select * from newmatchstats where seasonid=10;
                                                                 QUERY PLAN
----------------------------------------------------------------------------------------------------------------------------------------------
 Planning time: 0.244 ms
 id   rows_planned   rows_actual   skew   workers   node
  1          33820         33820   1.00       all   SELECT
  3          33820         33820   1.00       all   SCAN newmatchstats
                                                     (newmatchstats.seasonid::INT4 = $0) AND scan_constraints: (newmatchstats.seasonid = $0)
                                                     read_efficiency=99.6%, rows_from_column_store=33820, rows_from_row_store=0
 33820 rows returned
 Read: 296.00kiB, Distributed: 726.60kiB
 Database: premdb
 Version: 5.1.0-20201008122214
 Hostname: yb007-mgr0.yellowbrick.io
 query_id: 2864664
 Lookup cache hit: false
 Code cache hit: false
 Execution time: 735.490 ms, End time: 2020-11-02 12:14:02
(15 rows)
Use the STABLE option on the previous query
explain (analyze, stable) select * from newmatchstats where seasonid=10;
                                                   QUERY PLAN
-------------------------------------------------------------------------------------------------------------------
 rows_actual   workers   node
      33820       all   SELECT
                          distribute on (newmatchstats.seasonid)
      33820       all   SCAN newmatchstats
                          distribute on (newmatchstats.seasonid)
                          (newmatchstats.seasonid::INT4 = $0) AND scan_constraints: (newmatchstats.seasonid = $0)
 33820 rows returned
(7 rows)
Add the TYPE option to the previous query
premdb=# explain (analyze, stable, type) select * from newmatchstats where seasonid=10;
                                                                              QUERY PLAN
-------------------------------------------------------------------------------------------------------------------------------------------------------------------------
 rows_actual   workers   node
      33820       all   SELECT
                          (newmatchstats.seasonid INT2, newmatchstats.matchday DATE, newmatchstats.htid INT2, newmatchstats.atid INT2, newmatchstats.moment VARCHAR(5))
                          distribute on (newmatchstats.seasonid)
      33820       all   SCAN newmatchstats
                          (newmatchstats.seasonid INT2, newmatchstats.matchday DATE, newmatchstats.htid INT2, newmatchstats.atid INT2, newmatchstats.moment VARCHAR(5))
                          distribute on (newmatchstats.seasonid)
                          (newmatchstats.seasonid::INT4 = $0) AND scan_constraints: (newmatchstats.seasonid = $0)
 33820 rows returned
(9 rows)
Use the DISTRIBUTION and PARTITIONS options for a query on a partitioned table
Note that the newmatchstats table in this example is a partitioned table:
premdb=# describe newmatchstats;

----------------------------------------------------------------------------------------------------------
               Table "public.newmatchstats"
 ----------+----------------------+-----------+-------------
   Column  |         Type         | Modifiers | Description
 ----------+----------------------+-----------+-------------
  seasonid | smallint             | not null  |
  matchday | date                 |           |
  htid     | smallint             |           |
  atid     | smallint             |           |
  moment   | character varying(5) |           |

 Distribution: Hash (seasonid)
 Partition Columns:
    "matchday"   RANGE (BETWEEN date '1992-08-01' AND date '2017-05-31' EACH interval '1 year', IS NULL)
    "htid"       RANGE (BETWEEN 2 AND 51 EACH 1, IS NULL, OUTSIDE RANGE)

(15 rows)premdb=# explain (distribution, partitions) select matchday, count(*) from newmatchstats
where matchday like '1996-%' group by matchday order by 1;
QUERY PLAN
------------------------------------------------------------------------------------
id rows_planned workers node
1 11 single SELECT
distribute single
3 11 all DISTRIBUTE SORT
distribute single
4 11 all SORT ON (newmatchstats.matchday ASC NULLS LAST)
distribute on (newmatchstats.matchday)
5 11 all PARTITION BY (newmatchstats.matchday)
distribute on (newmatchstats.matchday)
partition by (newmatchstats.matchday)
7 1 all GROUP BY (newmatchstats.matchday)
distribute on (newmatchstats.matchday)
8 1 all DISTRIBUTE ON HASH(newmatchstats.matchday)
distribute on (newmatchstats.matchday)
9 1 all GROUP BY PARTIAL (newmatchstats.matchday)
distribute on (newmatchstats.seasonid)
11 206 all SCAN newmatchstats
distribute on (newmatchstats.seasonid)
partition by (newmatchstats.matchday)
newmatchstats.matchday::VARCHAR(64000) LIKE '$1'
Database: premdb
Version: 5.1.0-20201008122214
Hostname: yb007-mgr0.yellowbrick.io
(24 rows)Return the query plan for a running INSERT, using its query ID
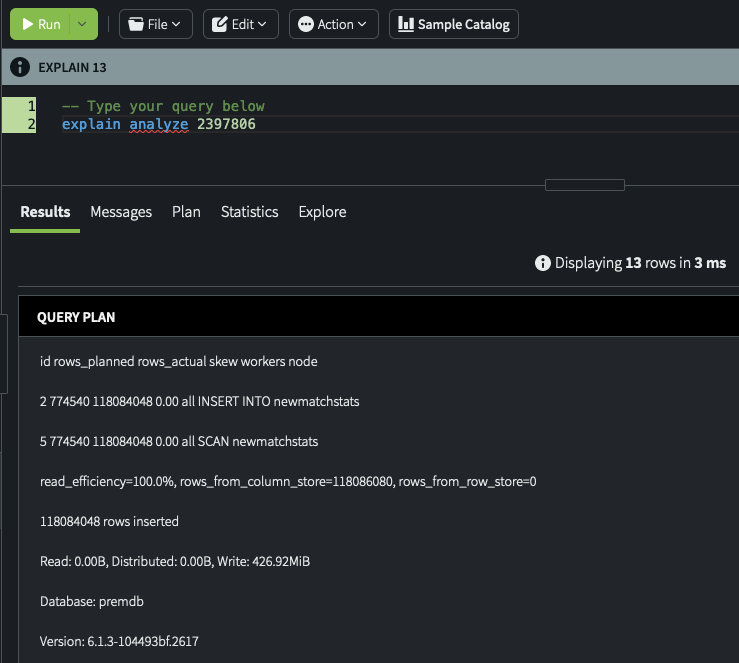
This example returns query plan information for an INSERT query that is currently running. The query ID (2397806) was previously selected from the sys.query view, then used in the EXPLAIN ANALYZE command. This example was run in the Yellowbrick Manager Query Editor.
EXPLAIN ANALYZE for a DELETE
This example shows the behavior to expect when you use the ANALYZE option on a statement that writes data. In this case, three rows are deleted from the season table. If you run this type of EXPLAIN command but do not want to delete, insert, or update the data permanently, wrap the EXPLAIN ANALYZE statement inside a transaction so that the changes can be rolled back.
premdb=# select count(*) from season;
 count
-------
   25
(1 row)

premdb=# explain analyze delete from season where winners='Arsenal';
                                                        QUERY PLAN
----------------------------------------------------------------------------------------------------------------------------
 Planning time: 0.265 ms
 id   rows_planned   rows_actual   skew   workers   node
  3              3             3   0.54    single   DISTRIBUTE RANDOM
  4              3             3   1.00    single   DELETE FROM season
  5              3             3   1.00       all   DISTRIBUTE WORKER
  7              3             3   0.00       all   SCAN season
                                                     season.winners = $0 AND scan_constraints: (season.winners = $0)
                                                     read_efficiency=0.0%, rows_from_column_store=3, rows_from_row_store=0
 3 rows deleted
 Read: 1.52MiB, Distributed: 72.00B, Write: 240.00kiB
 Database: premdb
 Version: 5.3.4-20211123225935
 Hostname: yb04-mgr0.yellowbrick.io
 query_id: 5249610
 Lookup cache hit: false
 Code cache hit: true
 Execution time: 128.120 ms, End time: 2021-11-29 14:58:35
(17 rows)

premdb=# select count(*) from season;
 count
-------
   22
(1 row)
Explain I/O Metrics
Below the query plan, there is a line containing aggregated metrics for the query. These metrics may include:
- Read/Write: The amount of data read from or written to storage by the query, excluding spill I/O.
- Distributed: The number of data bytes that are distributed across workers.
- Network: The total number of bytes transmitted over the network, which may exceed the Distributed bytes field due to InfiniBand (IB) protocol overhead.
- Spill Read/Write: The amount of temporary data read or written by the query during execution.
- Spill Space: The peak amount of temporary storage space used for spilling.
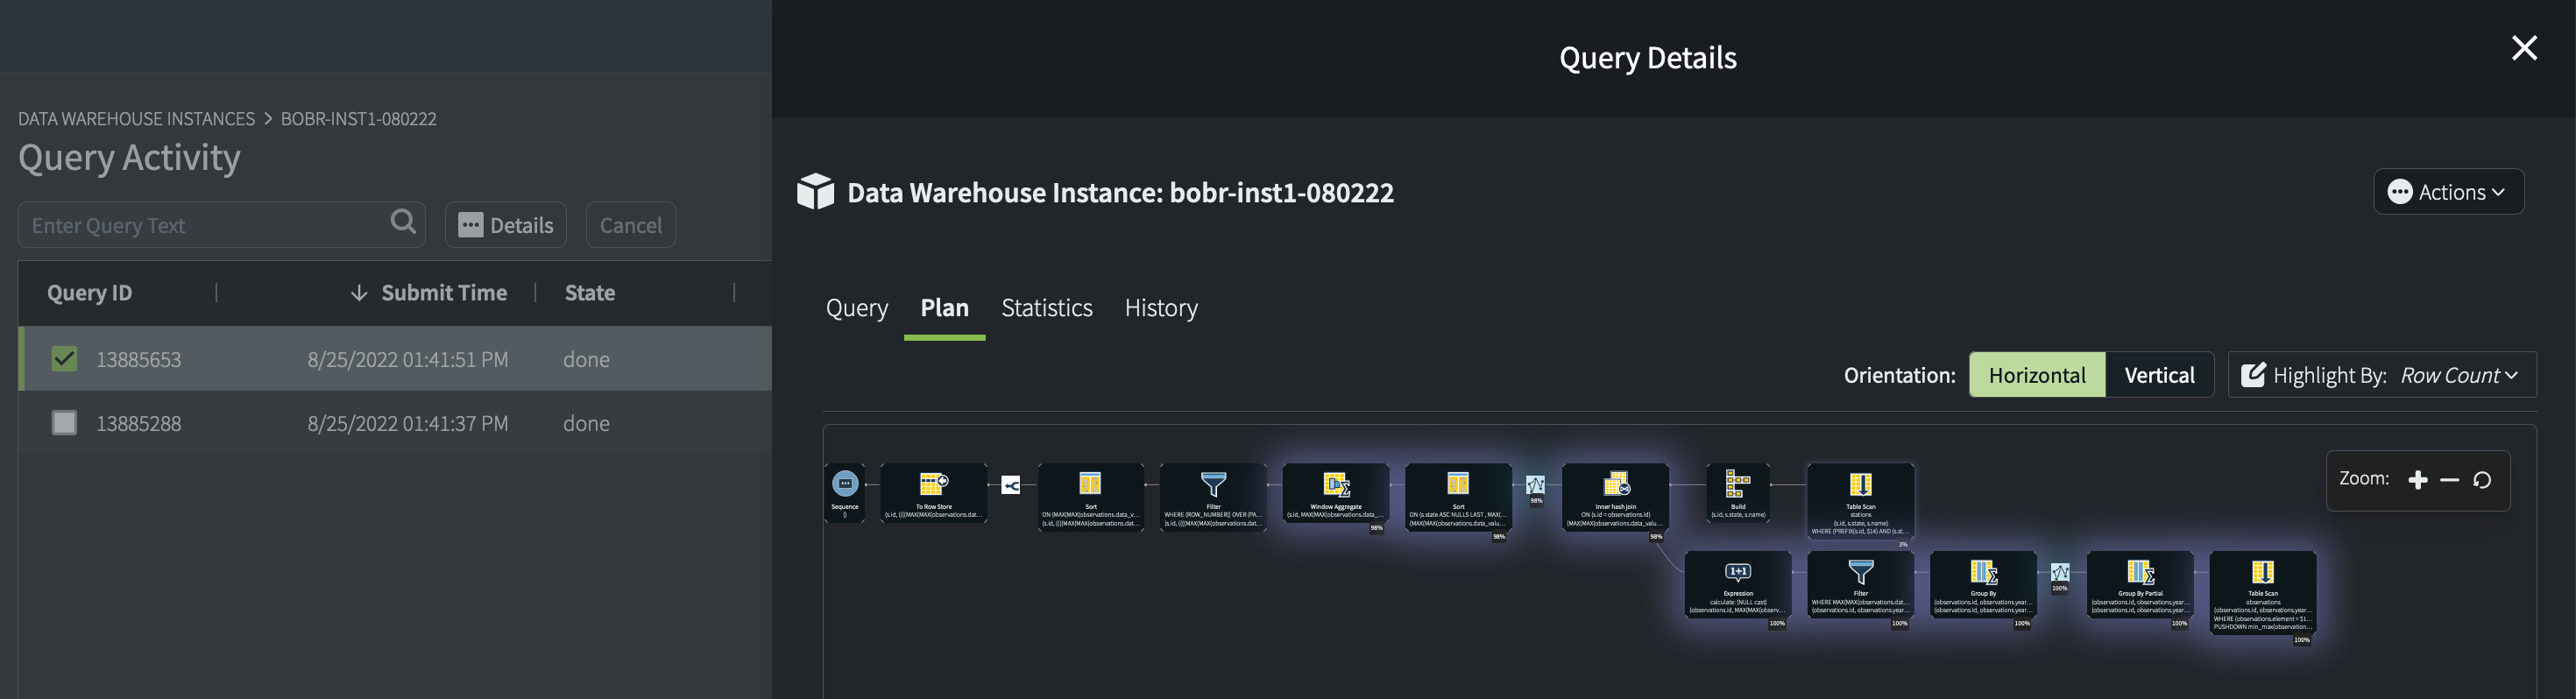
Visual EXPLAIN
Tip: You may also want to use the visual EXPLAIN feature. In Yellowbrick Manager, go to Query Activity > Details > Plan. For example: